Topics
strategy, sim game, analysis, positioning, product management, new products, team-building activity
Teaching Notes
Please note that there is also an instructional video is available at the bottom of the page.
Review the information below or download the PDF student worksheet
- Student Worksheet: Base Sim Game – How to Play Guide
- Download the Sim Game: The game is available for free download on this page… free marketing simulation game download page.
Student Information
Welcome to the instructions on the Marketing and Positioning Simulation Game. This simulation game is designed for students of marketing, strategy, and business.
Objective of the Simulation Game
The goal of the simulation game is to make the most money (points). In marketing, marketing staff are normally hired to maximize the profitability of a firm – therefore, your team should look to maximize accumulated profits over the (up to) eight rounds of the simulation.
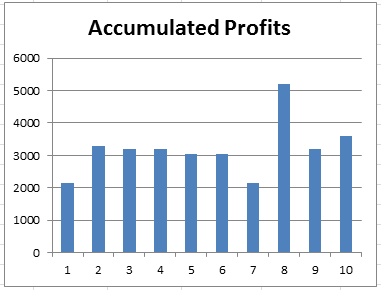
At the end of each decision round in the decision game, you will be provided with both numerical and graphical output (please refer to the diagram) of your profits to date (known as accumulated profits).
This is simply your revenue (sales) less positioning costs each round added together over the game rounds. In other words, it is the total amount of profit you have generated over the life of the game.
Your team goal is to be the leading team/firm at the end of the game. For example, in this image, Team 8 is the clear winner (with the most profits), while Teams 1 and 7 are the poorest performers. Keep in mind that this simulation game is designed as a learning activity for marketing and strategy.
Therefore, another objective of the game is for you to understand various marketing and strategic concepts. There are multiple business concepts that you will be exposed to when playing the game – and your instructor/teacher will help you in identifying and exploring these concepts further.
Main Decision: Where to Compete? (Positioning)
At the outset, this game appears to be “relatively” simple and straightforward – but don’t be fooled by this – like any game of strategy, it is quite complex and requires a good understanding of competitive behavior and payback on marketing investment (ROI).
You are competing in a market where consumers make decisions mainly based upon two attributes – namely quality and style/look. Therefore, this market could be: clothing, shoes and/or fashion accessories, household furniture, and so on.
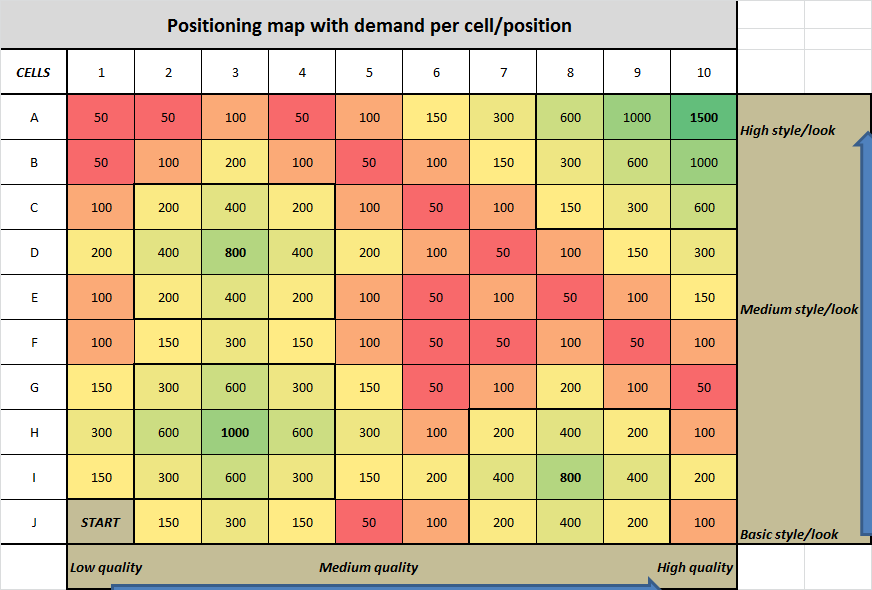
Each positioning “cell” (as seen in the perceptual map), represents the level of market demand (sales/points) for every combination of positioning (using the two attributes of quality and style/look).
Your team has to decide “where to compete” (where to position) your products. Looking at the perceptual map, you can see that positioning cell “A10” is the most attractive (with 1,5000 points/sales) – but keep in mind that this could be the most competitive and it is more expensive to develop a product with the highest quality and the best style/look.
In other words, while “A10” appears the most attractive at first glance, it might end up being a “profit trap” – it depends upon competitive actions and other possible opportunities.
Four main market segments
As you can see from the perceptual map above, there are four key target markets. These sit in cells “A10”, “D3”, “H3” and “I8”. These positioning cells are color-coded in a green color, indicating that they are quite attractive (yellow is moderately attractive and red is less attractive – in terms of base market demand/sales).
The “A10” cell represents the “status seekers” segment. They want the best quality product, with the best style/look and are happy to pay for it. That’s why they are the largest segment (most points) in the market. You should also note that the surrounding cells are also quite attractive in terms of game points.
The “C3” cell represents the “fashion conscious” segment. This segment of consumers want a good looking (relatively high style/look) product that is quite appealing and socially acceptable, but are happy to forego a high level of quality in order to purchase a more affordable product.
The “H3” cell represents the “budget conscious” market segment. This segment is happy to accept both a lower level of quality and more basic style/look, most likely to purchase a lower cost and more affordable product.
The final segment is centered around the “I8” positioning cell. This segment is the “quality focused” segment – as they are seeking high quality products, but are less concerned with the style/look (fashion) aspects of the product.
Note: When playing the simulation game, try to avoid qualitative assessments of where you would like to position your products. Instead, look at the market based upon profit/points opportunities, return on investment and the current and likely future behavior of your competitors.
Product Development and Positioning Costs (200 points per square)
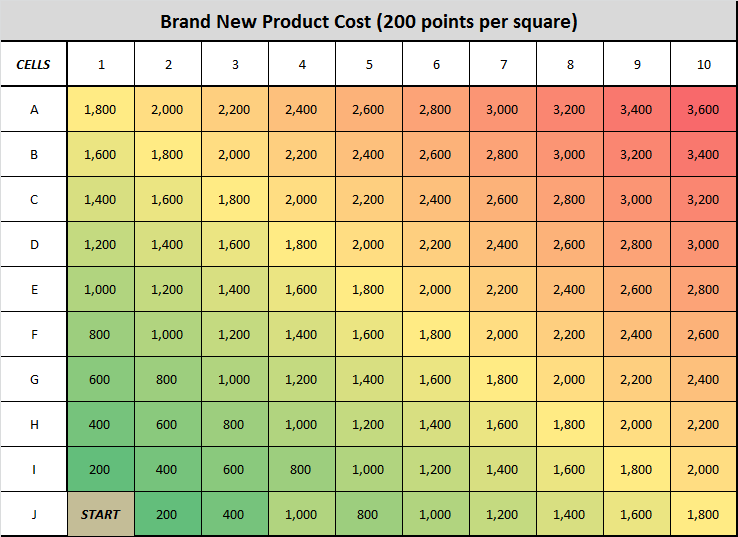
Like most things in marketing, making decisions in the game costs money (or, in this case, points). You start with a basic generic product (please see the “START” cell) for free. This product has base level quality and base level style/look and no market demand either.
In order for your team to improve and develop the product (add quality and style/look attributes) it will cost you 200 points for every cell you choose to move (position). Please note that you can only move horizontally or vertically – not diagonally.
For example, if you want to position a new product in cell “H3: – the budget conscious segment – then this will cost your team 800 points (moving up two squares and then across two squares = four squares X 200 points each = 800 points in total.
Repositioning Costs (still 200 points per square)
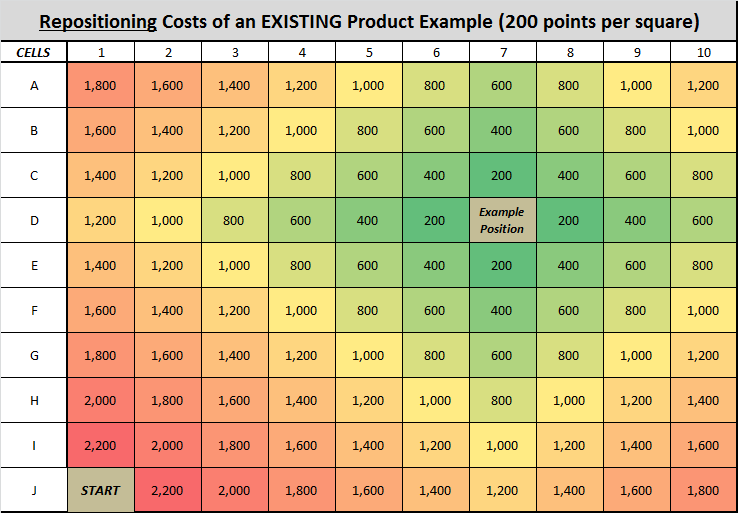
Your team may choose to reposition your existing product/s at any time. You might choose to do this because your product is in a very competitive positioning cell or you might need two or more moves to develop your product to its desired positioning goal.
Either way, to keep the game consistent and simple, each cell that you choose to move costs the same 200 points per cell – as per the example diagram here. Even if you reduce quality and/or style/look, there is still a 200 point cost in the game. This is because you need to both redesign the product and re-educate the market about the product and its particular attributes.
Your decision sheet
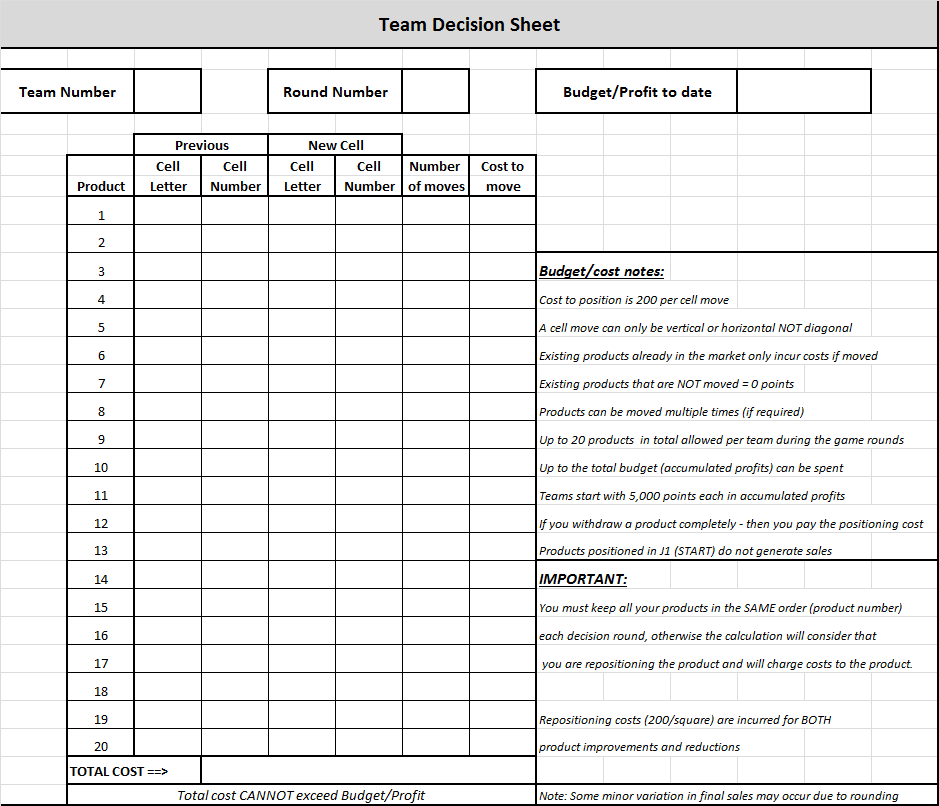
Here is a copy of your team’s decision sheet for the game – which your instructor will provide for you. As you can see, your main decision is to decide on how many products to have in the market and where to position (which cells) to position your products.
In round one of the simulation game, your team starts with 5,000 points – this is your budget, to spend on positioning your products (as per the cost discussion above). In your decision sheet , you need to enter (for each existing and proposed product) the positioning cell that you wish to target.
Each of these decisions – if differ to the previous round – will cost your team points (as discussed above). If you have an existing product AND you don’t move it during that round, then there are no costs incurred. You should carefully think about your marketing spend. In round one you have 5,000 points to spend.
From round two onward, you have your accumulated profits in total to invest. But please ensure that you will get a financial payback on your investment – this is more critical near the end of the game (up to eight rounds maximum) as you will have less years/rounds to recoup your investment.
Please ensure that you maintain your products in the same sequence on the list in each decision round – otherwise the computer calculation will consider that you are repositioning the product and you will be charged points for repositioning – remember that one of your goals is to make your marketing investment as effective as possible.
Your only other entries on your decision sheet is your team number – that will not change during the game – and the round number and your budget for the round (which is provided to you at the start of each decision round – it is your accumulated profits at that time).
Game outputs and metrics
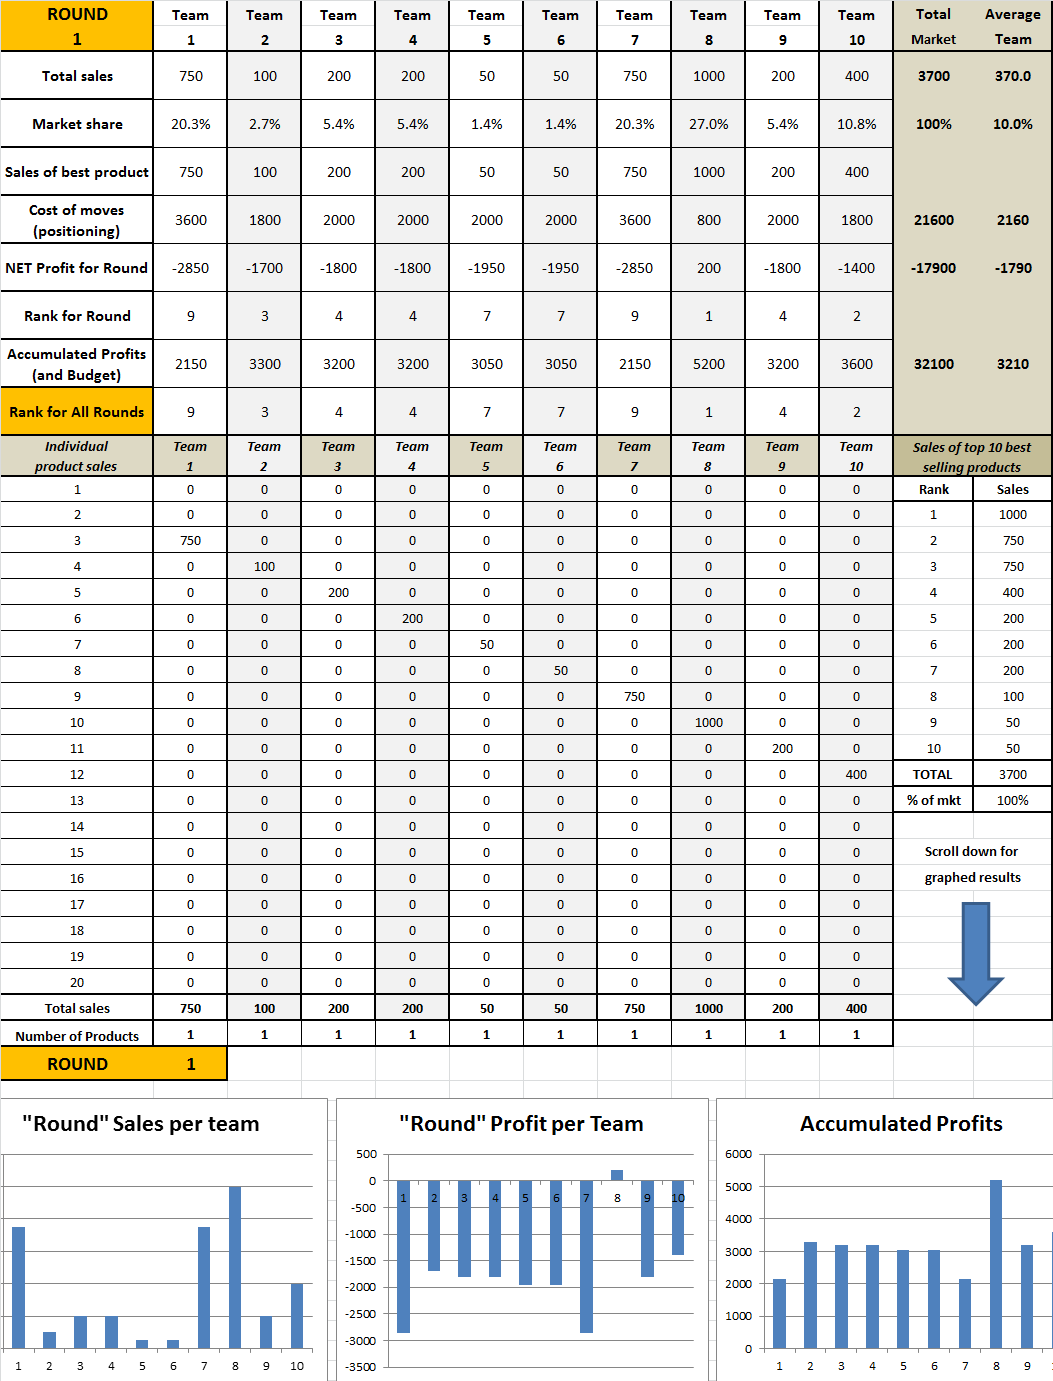
Here is most of the game outputs/results per round. The results for each team is provided. Take the time to consider and analyze the information – as a key part of success in the simulation is to understand your competitors’ strategies and to even predict their likely decisions.
As you can see, you are provided with: total team sales (revenue/points), resultant market share, sales/points of each team’s best selling product, total positioning costs (marketing investment), and revenue less costs gives you “net profit” for that round and how your team ranks for net profit.
Underneath we have the key metric for the simulation game, which is accumulated profits. The “winner” of the game is the team with the most accumulated profits by the end of the rounds. This is also ranked in order of best team performance.
On the right hand side of the individual team results, we have the total market and the average market results. This gives you a good understanding of how the total market is expanding and how you compared to the average team within the simulation game.
The next main section of the results output page is the individual sales result of each product within the marketplace by team. This is helpful information to understand which teams are performing well and why. You can then compare their sales results for an individual product back to the particular positioning cell that they are targeting in order to identify their success.
Armed with this information you may choose to directly target and compete with these successful competitors, or you may choose to seek out opportunities with less competition. Either way it is helpful information. At the bottom of this section you’ll see total sales for each team – repeated from above – as well as the number of products that team has in the marketplace.
Please remember that you have a maximum of 20 products to use and introduce during the game. There is no ability to withdraw products from the market once are entered and are established products in the marketplace. Alternatively, you should look to reposition poorly performing products instead.
On the right-hand side of the individual product sales you will find a listing of the top 10 best-performing products in the marketplace. This is helpful, particularly in a cluttered marketplace later in the game with it could be up to 200 products, to identify how many of the main selling products your team has in the market.
Think of it like the top 10 TV shows for instance. You may choose to challenge some of the major firms with products in the top 10, and you should think about protecting your more successful products. Finally, underneath the individual product sales results, there are three graphs presented which cover the main key metrics of “sales per round”, “profit per round”, and most importantly “accumulated profit”.
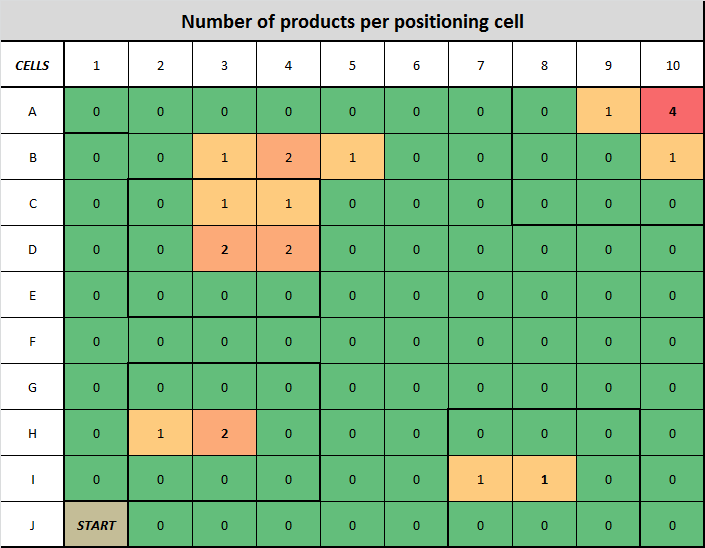
It is this the graph – as discussed above – which is THE key metric for performance in the simulation game. Another useful diagram that will be provided by your instructor/teacher is the number of products that are in each positioning cell – as shown here.
The red colored cells indicate that there are a higher number of products competing in that particular cell, whereas the green cell indicates a lower level of competition. This is a very helpful tool to enable you to select the most appropriate cells to target and reposition and develop new products for.
Obviously, all of these tables and charts need to be used in conjunction with each other, to help you determine the best strategic choices for your team in the simulation game.
How the sales points work
This is a relatively straightforward calculation, with a slight twist. The points listed above representing market demand in the initial chart/perceptual map out the key number. For example, if you have positioned a product in a cell that has 1,000 points listed, and your firm is the only one in that particular cell, then you will win 1,000 points in sales.
However, if you are targeting a cell with 1,000 points, and there is another product in the same cell, then the points are equally distributed – 500 points each. Likewise, if there are five different products in a cell with a maximum of 1,000 points, then each team would generate 200 points.
If your team chooses to enter two products into the same cell, say worth 1,000 points again, then each of your products would earn 500 points each provided there was no other competitors targeting that cell. While this may seem a strange approach at first, by entering two products into the same positioning cell, you can substantially reduce the threat of new competition – as there is less incentive for competitors to choose to target that positioning cell.
A loyalty and price premium bonus
In addition to the above sales calculation, there is a simple “bonus” provided to the existing (not new) products in the market – whether they are predisposition or remain in the same positioning cell. Existing products automatically earn an additional 10% of their previous sales.
This represents the natural advantage existing products have the new product in the marketplace. This represents a “bonus” for likely customer loyalty, increased purchase frequency, and price premium ability. For example, if you have a product in a cell that is worth 500 points and you are the only product in that cell, then you will win 500 points in the first round.
In the next round, you will win 500 points plus a 10% bonus of the previous points – an extra 50 points – giving you 550 points in total. This loyalty bonus will compound for each round that you don’t reposition the product.
But watch out for competitors! For example, in a round where you had 500 points previously, a new competitor enters that particular positioning cell. Therefore your points would be, half of 500 = 250 points plus 10% of the previous 500 (50 points) giving you 300 in total, whereas your competitor (being a new product) would win half of 500 points = 250 points.
That is probably the most complex calculation you need to do in the simulation game. This provides an incentive to protect your high-performing products as a will generate a greater bonus for you. Whenever they are challenged by competitors, their bonus potential also decreases – so it is often in your interests to protect your major products.
A video of the simulation game rules and instructions
Here is a video – which repeats most of the above information – but may be helpful in clarifying some of the rules and approaches of the simulation game – ideal for students to review!