Topics
cross-tabs, market research, analysis, Excel template
Teaching Notes
Overview: This activity provides students to utilize an easy-to-use Excel template to learn how to use and interpret cross-tabs when analyzing market research data. As well as cross-tabs, the template also allows students to produce charts quickly – an ideal tool for their assignments and reports. The purpose of this Excel tool is to familiarize students with constructing cross-tabs for marketing data analysis.
Teaching Level: Intermediate – students need to be familiar with marketing research survey data and the purpose and basic techniques of data analysis.
Please note that students need access to Excel or other suitable spreadsheet software to utilize this tool.
Suggested Structure: Learning how to use this analysis tool is best run on an individual student basis so that they can get familiar with using the Excel template and get comfortable with running cross-tabs (as we know, as it is less effective learning to use software by watching other group members). However, after running multiple cross-tabs, student groups can be quite effective in discussing and identifying insights from the data.
Approximate Timing: Assuming that you have some survey data that you are using for your students, you should allow around 60 minutes to run multiple cross-tabs (individually) and getting the groups to discuss and identify their key insights, and then present a summary of their findings to the class.
Download the free cross-tab Excel template (please also provide template or link to students)
- Download the template here… cross tab and count data 2020
About the Template
Suitable for Most Student Excel Skill levels
Students are very familiar with Excel normally have no challenges in producing graphs and potentially even running cross-tabs using pivot tables. However, not all students are at this level, which creates a challenging teaching environment and an “unfair” playing field.
Therefore, this free Excel template has been structured with the beginner Excel user in mind. Most students, even those with limited Excel skills, would be able to use this template to produce dozens of charts and run many cross-tabs very quickly.
Designed for preliminary analysis of a survey or a customer database
The big advantage of this template is its speed of producing charts and cross-tabs. Once the data has been effectively labelled and then copied and pasted into the worksheet, then graphs produced automatically by typing in a variable/question number. And cross-tabs are also automatically produced by typing in the two questions/variable numbers that you want to compare, as shown here:
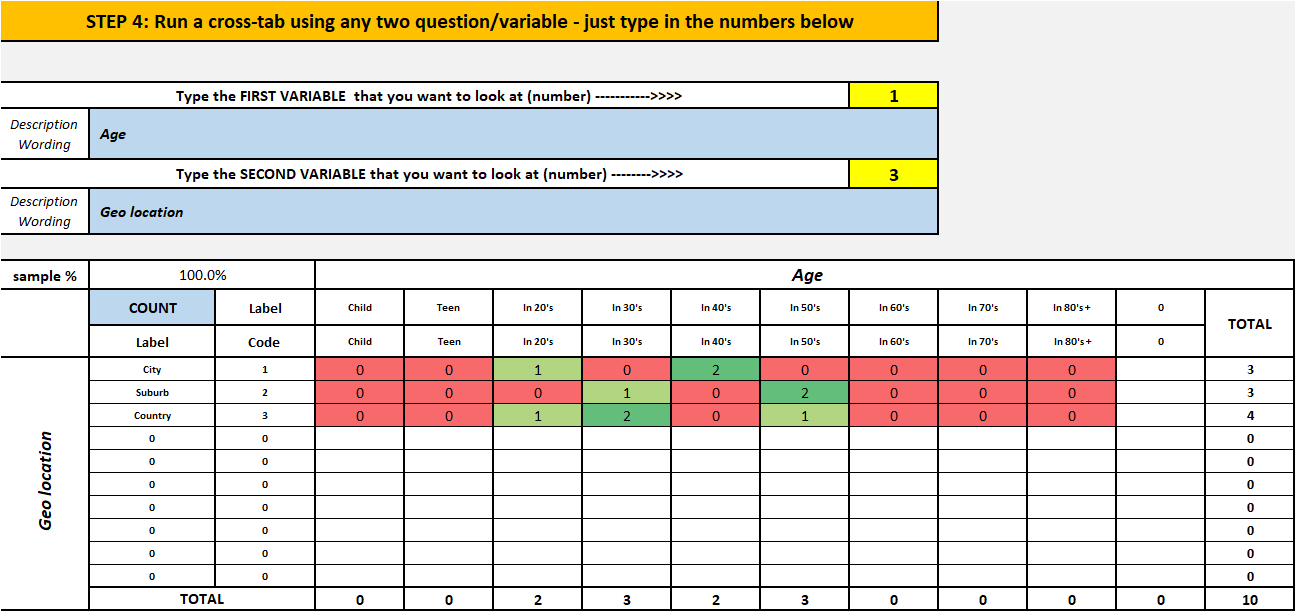
This “pre-set” approach enables students to “crunch” through a lot of data very quickly to identify key points and insights, rather than getting bogged down with formatting two or three charts for their analysis.
How-to-use Information
More information on how to use the template, which you can download above, is also available at the Marketing Study Guide, or alternatively here is a short instructional video
.
Related Tools