Introducing the Gantt Chart Excel Tool
Gantt charts are an excellent way of overall project planning, tracking progress, assigning responsibilities, and monitoring the overall project. Gantt charts are widely used in business and are an excellent addition to students projects, especially team-based longer tasks.
Great Ideas has developed this Excel-based Gantt chart template to help in the planning of projects and other team-based activities. It is simple and easy-to-use and does not require the user to be experienced in Excel.
What the Gantt Chart Template Does
Note: Below is a video on how to use this Gantt chart template.
The template is fully automated. You only need to enter the following information:
- Name/title of each project task
- Start date for each task
- Time required to complete each task (in the choice of days, weeks, months, or years)
- Who the task is assigned to (optional)
- How far the task has been progressed (choosing from 0%, 25%, 50%, 75%, 100%) (this is also optional)
This template will then automatically produce:
- The end date for each task (based on the start date and the time required for that task)
- Color shading for when each project task is running
- Responsibilities, with each staff/person having their own color
- Percentage of each project task completed (0%, 25%, 50%, 75%, 100%, which are also color-coded)
The template allows for up to 15 staff/people, up to 200 tasks, and up to 50 date ranges (that you set to days, weeks, months, or years). Please note that the Gantt Chart is fully interactive. This means that when you change dates, reassign responsibilities and/or modify the progress of the task – that the colors and/or date range will automatically update.
Once completed (or updated), you can copy/paste the Gantt chart into a presentation or report.
Download the Gantt Chart Excel Template here: Gantt Chart Excel Template-2022
What the Gantt Chart Excel Template Looks Like
Here is an example of the output from the Gantt chart template…
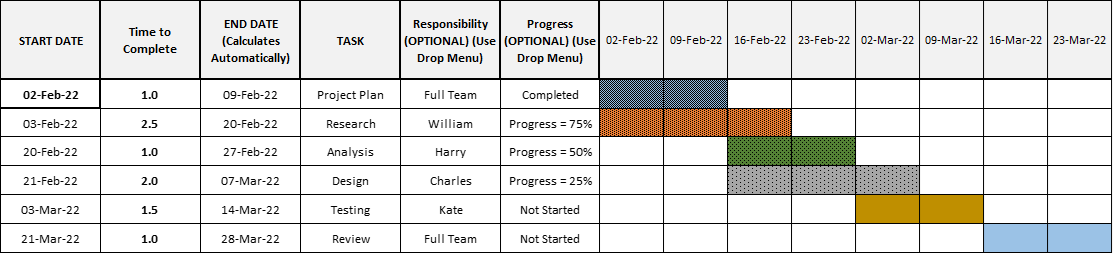
As you can see above, each person/staff member has been allocated their own color. And when the Full Team completes their first task (in the top row) the blue color is shaded with a pattern, but when they have not started a task (see last row), the color is completely unshaded.
As the task is progressively completed, the color coding will be populated with more dots (pattern). This allows for a visual check of who is responsible and what percentage is completed – this is great for individuals checking their own progress and upcoming tasks.
In the template, the progress drop-down menu allows for the options of:
- Not Started = 0%
- Progress = 25%
- Progress = 50%
- Progress = 75%
- Completed = 100%
You will note that the staff member and the % progress fields are optional. This is ideal for a fast Gantt chart or for simple planning by individuals. In this case, the above output would look like this…
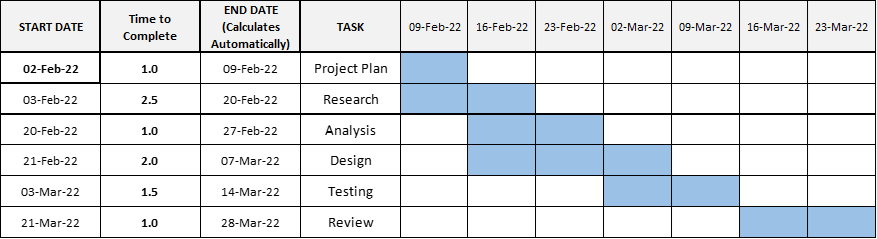
In this case, the color shading and pattern is the same, but without the color-coding for staff and percent progressed. This gives the template the benefit of flexibility.
This Gantt Chart Template is designed for…
- Students needing to plan their group (and/or individual) work tasks
- Students needing a Gantt Chart or timetable for input into a marketing plan or other assessment task
- Marketing practitioners needing a quick, easy-to-use, and project planning tool (for new product launches and other projects and campaigns)
- Project managers at small business and non-for-profits needing a reliable Gantt Chart maker for their planning
- Work teams that need to update their progress on a Gantt Chart template that everyone can use
- Individuals looking to plan their work or other task
How to Use the Template (Video)
Related Tools and Activities
External Articles