Topics
sim game, brand management, marketing mix, strategy, profit, competition, team building
What you need to get started:
- Download the Marketing Mix Sim Game here: Marketing Sim Game
- Download the Student Decision Sheet here: Marketing Mix Game Team Decision Sheet
- Download the Student Information Guide here: Student Information Guide
- Here is a link to YouTube instructional video for students (or see at the end of this page): https://www.youtube.com/watch?v=pUcsJCtyhqA
Here is an instructional video for lecturers, followed by written instructions.
Introducing the Marketing Mix Sim Game
Design of the Game
- Ideal student cohort = senior high school or undergraduate students
- Maximum number of teams = 10 teams
- Minimum number of teams = 2 teams
- Maximum number of rounds = 5 rounds
- Minimum number of rounds = at least 3 rounds recommended
- Student learning curve = approximately 30-45 minutes
- Total time required to play the sim game = around 3-4 hours (it can be played over several sessions)
- This timing is based on 30-45 minutes for instructions, then 30 minutes per decision round (5 rounds), plus 5 minutes to enter and produce the results
- The game runs on Excel and no Excel skills are required = easy-to-use
- Teachers only need to enter the student’s decisions and the game results are automatically produced
- The game is provided free for educational use only (commercial use is prohibited)
Marketing Topics that the Sim Game Covers
- The 4Ps marketing mix
- Market segments and target market selection
- Direct and indirect competition
- The role of channels
- Pricing and its impact on profit
- Pricing in conjunction with sales promotions (discounts)
- Brand management
- Short-term versus long-term marketing decisions
- Marketing’s impact on financial performance
- Marketing metrics and analytics
Making Decisions in the Sim Game
In this marketplace, up to 10 student teams compete in the Smart TV market. Each team has two brands to manage. And each decision round they need to make these six decisions for each of their brands:
- What is the overall quality of our product line (on a scale of 1 to 10)?
- What is the standard of our product’s look and design (on a scale of 1 to 5)?
- What is our retail price?
- How many channels will we use (from 1 to 4)?
- What discount (sales promotion) will we offer (if any)?
- What is our brand advertising spend?
As you can see, teams need to make decisions around each of the 4Ps, where the choice and combination of their decisions should be based upon the needs and preferences of their target market (discussed further below).
Here is what the teacher’s input screen (on Excel) looks like:
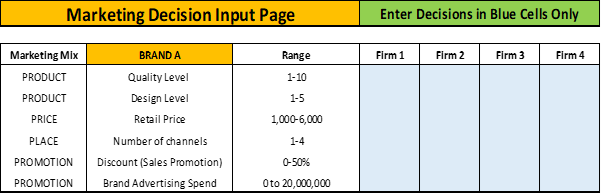
The input (in Excel) continues across for all 10 firms and then it is repeated down for Brand B. Teachers will need to enter the student’s decisions in the blue cells – and once they are all entered – the results are automatically calculated and ready to view.
The student’s decision sheet is similar in design, as follows (and can also be downloaded above):

The student’s decision sheet and the teacher’s Excel input screen are identical, making input easy.
You should also note the section underneath the decisions – which is also on the Excel game and is calculated automatically for the instructor – this is a working calculation section for the students. Importantly, they need to work out their unit profit margin per brand, which is a critical component in their overall profitability goal.
About the Market Segments
Underpinning the game’s marketplace is three market segments – but students only have two brands – making it necessary for teams to make an important strategic decision of where to compete?
Here is a summary of the segment needs, preferences, and behaviors. Please note that this information is also included in the Student Information Guide available for download above.
| Segments | Budget-Conscious | Value-Focused | Premium-Oriented |
| Initial Segment Size | 500,000 unit sales | 250,000 unit sales | 100,000 unit sales |
| Segment Growth Rate | 2% per round | 10% per round | 15% per round |
| Key Needs | Focused on price and sales promotion deals | Looking for a nice balance of product quality and value | Seeking higher quality and better looking products |
| Preferred product quality range | Low to medium
2 to 6 levels |
Medium quality
3 to 8 levels |
Higher quality 7 to 10 levels |
| Preferred product design range | All segments prefer a higher design/style level, depending on price and discount | ||
| Preferred price range | Prefer well under 2,000 and seek relative lower prices | Willing to pay 2,000 to 4,000, but prefer relative lower prices | Willing to pay 3,000 to 6,000, but prefer relative lower prices |
| Discount (sales promotion) response | All segments are responsive to a good deal | ||
| Importance of brand | All segments are responsive to brand building (relative to competition) | ||
Important Note: This information is a guide only. The responsive of segments will depend upon competitive offerings in the market. Players should seek to analyze the results to improve their decision making during the game.
Decision Making Guide and Parameters
Each team needs to make six marketing mix decisions each round for EACH brand.
Each brand operates completely independently and their decisions are NOT interrelated. This means that teams can make different marketing decisions for each brand. And they can even compete against each other (which might be a defensive strategy against competitors).
The following table gives more insight into each of these decisions and how the market may react.
|
Quality Level |
1-10 Enter a single digit number |
This is the overall quality of the Smart TV, such as picture quality, sound, other features 1 = Lowest quality 10 = Highest quality |
|
Design Level |
1-5 Enter a single digit number |
This is the look (style, attractiveness) of the Smart TV 1 = Lowest (less attractive) 5 = Highest (most attractive) |
|
Retail Price |
1,000-6,000 You may enter decimals, if required – but psychological pricing is NOT built into the game’s design |
This is the expected price (reference) range of TVs in the market Teams should select a price based upon the quality and design of their TV Note that you can set a price as low as 500, by setting a 1,000 price with a 50% discount |
|
Numbers of channels used |
1-4 Enter a single digit number |
The more channels, the greater your brand’s retail reach, as follows: 1 channel = 50% reach 2 channels= 75% reach 3 channels = 90% reach 4 channels = 100% reach
|
|
Note that each channel requires support costs of 2,000,000 per round (for each brand) |
Example: 3 channels x 2 brands = 12,000,000 support cost for the round |
|
|
Also note that placing your brands in too many channels may reduce your brand equity |
Brands placed in 2 or 3 channels tend to have better brand equity |
|
|
This means that there is a trade-off in the two points above |
More channels = greater reach, but may reduce brand equity |
|
|
Discount (Sales Promotion) |
0-50% Enter as a percentage |
You can set a discount of up to 50%. This is optional and you can set to 0% if preferred However, segments tend to respond better to the same price if a discount has been applied That is, 4,000 X 25% discount = 3,000 sells better than 3,000 X 0% discount = 2,000 |
|
Brand Equity Index |
This is not a decision or a visible metric, but it works behind the scenes in the calculation of the results |
The brand equity index is a combination of your marketing mix elements In takes into account overall product quality, channels, pricing, and promotional spend It is a relative measure, considered against your competing teams |
|
Brand Advertising Spend |
0 to 20,000,000 Optional spend |
Brand advertising spend is optional, but you may choose to spend up to 20,000,000 per brand per round. Note that brand advertising has a residual effect and will linger in the segment’s memory over time. |
|
REMINDER: These decisions are made on a per brand basis, so these decisions will need to be completed for both Brand A and Brand B. And both brands are independent of each other – that is, changes to one brand will not impact the other brand’s decisions. |
||
How to Calculate Unit Profit Margin
The key goal of most businesses is to maximize long-term profitability – not just unit sales and/or market share. To achieve good profits, it is important to work out the profit margin per unit.
As the Smart TVs increase in quality level (from 1 to 10) and in design level (from 1 to 5) – so does their cost. There is a formula that converts product design to its unit cost to, as follows:
- Unit cost = quality level X 250 + design level X 150
- As an example, a TV with a quality level of 6 and a design of 4 gives: 6 X 250 + 4 X 150 = 2,100
Now we have unit cost, we also need to work out the final selling price, which is the set retail price less the percentage discount (sales promotion).
- As an example, a TV with retail price of 6,000 with a 33.33% discount will sell for 4,000 in the market
Therefore, in this example, our unit profit margin will be:
- 4,000 (selling price) less 2,100 (unit cost) – 1,900 unit margin
And remember this is just the variable costs covered, and teams still need to make enough gross profit to cover the fixed costs of channel support and any brand advertising.
Reviewing the Tabs/Worksheets in the Excel Game
The tabs that are in the sim game are:
- Info
- Input R1
- Input R2
- Input R3
- Input R4
- Input R5
- Results
- Charts
- Shares
The Info tab is just basic contact information and information links and is not required to play the game.
The tabs of Input R1 to Input R5 are the where the team’s decisions are entered for Rounds 1 to 5. Each round has a separate input tab for decisions, where R1 = Round 1 etc. This feature is designed to ensure that prior decisions are not accidentally typed over and changed, however please check that you move to the next decision tab after each round.
The Results tab shows a summary of sales, market shares, costs, revenue, and costs. At the bottom it shows the Net Profit for both the current round and all round to date – this is the metric that shows the leading team.
Note: all 5 rounds are on the same tab, just scroll down to see all rounds.
The Charts tab summarizes four key metrics per round on a total Firm basis (that is both brands together), taken from the Results tab. It is a handy visual tool for showing teams quickly how they are performing. The four charts shown are:
- Total Unit Sales = number of TVs sold
- Total Revenue = total value of retail sales in the market
- Total Net Profit = net profit for the round = first place is the winner for the round
- Net Profit All Rounds = combined net profit for all rounds = first place is the overall leader
Note: all 5 rounds are on the same tab, just scroll down to see all rounds.
The Shares tab shows market share by firm by brand for each segment AND unit sales by firm by brand for each segment.
It is a helpful planning and analysis tool, where teams can see where they are doing well (or otherwise) and which competing teams are their direct competitors. This information can then be compared to each round’s decisions to help players analyze what is working and why. In other words, what do we need to change to improve our performance and competitive position.
Note: all 5 rounds are on the same tab, just scroll down to see all rounds.
Some FAQs
Do I need a password to use the sim game?
No. The Excel file protects the game algorithm, formulas and outputs and they cannot be changed. However, no password is required to play the game.
Do I need to “run anything” in Excel?
No. The game is fully automated. You simply enter each team’s decisions, and once done the results are ready to view.
Can I give a copy of the Excel game to student teams?
Yes – this a good idea for more advanced student cohorts, as it is very helpful for decision making and for playing with scenarios. Obviously each team requires access to Excel.
Can I run the game in Google Sheets?
Probably not. There are lots of formulas and calculation in the game – as well as hidden worksheets – so it is best to stick with Excel where it has been tested.
Can anything go wrong?
The spreadsheet template is protected and only allows entry for team decisions. But… if the entries are incomplete (for example, you don’t enter a price for a team) then the results will show zero for that team.
Tip: Anytime there is blank or zero results (when there should be some), please recheck the decision inputs and make sure they are complete.
How reflective is the game of market reality?
It is a sim game – which means it is half simulation and half a game.
From the simulation perspective, there is a lot of underlying marketing logic built into the game and segments (consumers) tend to response logically given the competitive marketing mix offering available.
And from the game perspective, it is not marketing mix model and various assumptions and heuristics have been built into the game’s results and overall marketplace.
But this is a good thing – as marketing students need to be responsive to the feedback (results) from a market and not rely upon assumptions and how they think that the market will respond.
Can Teams Lose Money and Run at a Loss?
Yes that’s possible, but any team making sensible marketing decisions should make a good level of profitability.
How Responsive is the Game to Marketing Decisions?
This sim game has been designed for a high level of responsiveness. That is, the market can react substantially to major changes in decisions.
Please advise your students that a real marketplace would have greater stability, however this sim game has been built to be responsive so that it is possible to both catch up and lose a big lead – making it a more exciting game to play and to learn from.
What if some of the results/outcomes don’t make sense?
There is no randomness built into the game – but different combinations of decisions, especially as compared to competitors, will result in different market outcomes.
For example – a team who is the only team spending big on advertising will get a good uplift in sales, but if several other teams also spend big (and match them) then the uplift will be much lower. This means that a tactic that work well in Round 1 may not be as effective in a later round.
Therefore, there is an underlying logic for all of the results – but the overall combination of decisions (both the team and their competitors) need to be taken into account. The game computes the overall package of decisions – both in that round, plus some brand building factors from prior rounds.
A goal of the student teams should be to analyze and understand this marketplace – and it is often helpful to examine the performance of competitors as well, not just their own results. In this regard, the market share (tab) information should be quite helpful as well.
Can Brands Be Repositioned and Redesigned?
Yes – and there is no cost to redesigning the quality level of the product (or modifying and element of the marketing mix). And teams may move up or down (or remain the same) on any marketing mix element each round.
While this “no cost” approach to product development is not reflective of market reality, it has been designed in this manner to ensure a more dynamic and changing marketplace and environment for the players.
Is the game easy for students to learn?
It should be for most cohorts.
However, depending on your student cohort, you may want to limit each team to ONE brand only in Round 1. This will help players get a better sense of the game and how it works.
Alternatively you could have a practice round, or even have a practice game first and then replay the game, but this time with experienced marketing managers.
Is there one best strategy to win this game?
Nope – like all games, it depends on the competition and their decisions – so while all teams should start the game with a clear marketing strategy, it may be necessary to review that plan as the game and the competitor’s decisions unfold.
Instructional Video to Share with Students (or provide the link above)
Other Related Activities and Information