Topics
Return on marketing investment (ROMI), planning, teamwork, game
Review the activity below or download the PDF student worksheet
- Student Activity Worksheet: Return on Marketing Investment Game
- Scoring template: To help with this exercise, I have developed this Excel template that allows the student teams to track the results – or you could also run as an overall class exercise… romi-activity
- Instructor Solutions (Members Only): Return on Marketing Investment Game = Solutions
Student Discussion Activity
Introduction
Return on marketing investment (ROMI) is a commonly used marketing metric in the business world. But addressing this metric from a straight formula/calculation approach can be a little dull. So here is a fun activity that can be a great way of introducing the concept of ROMI – its usage and purpose – to marketing students.
How the ROMI Game Works
It is a simple variation of an old training game regarding goal setting, except we will use it to help measure marketing profit and return on marketing investment.
Equipment and set up needed:
- a few soft balls to throw per team (or you could use small Lego bricks, or even screwed up pieces of paper)
- three small buckets per team (or you could use chairs in the classroom)
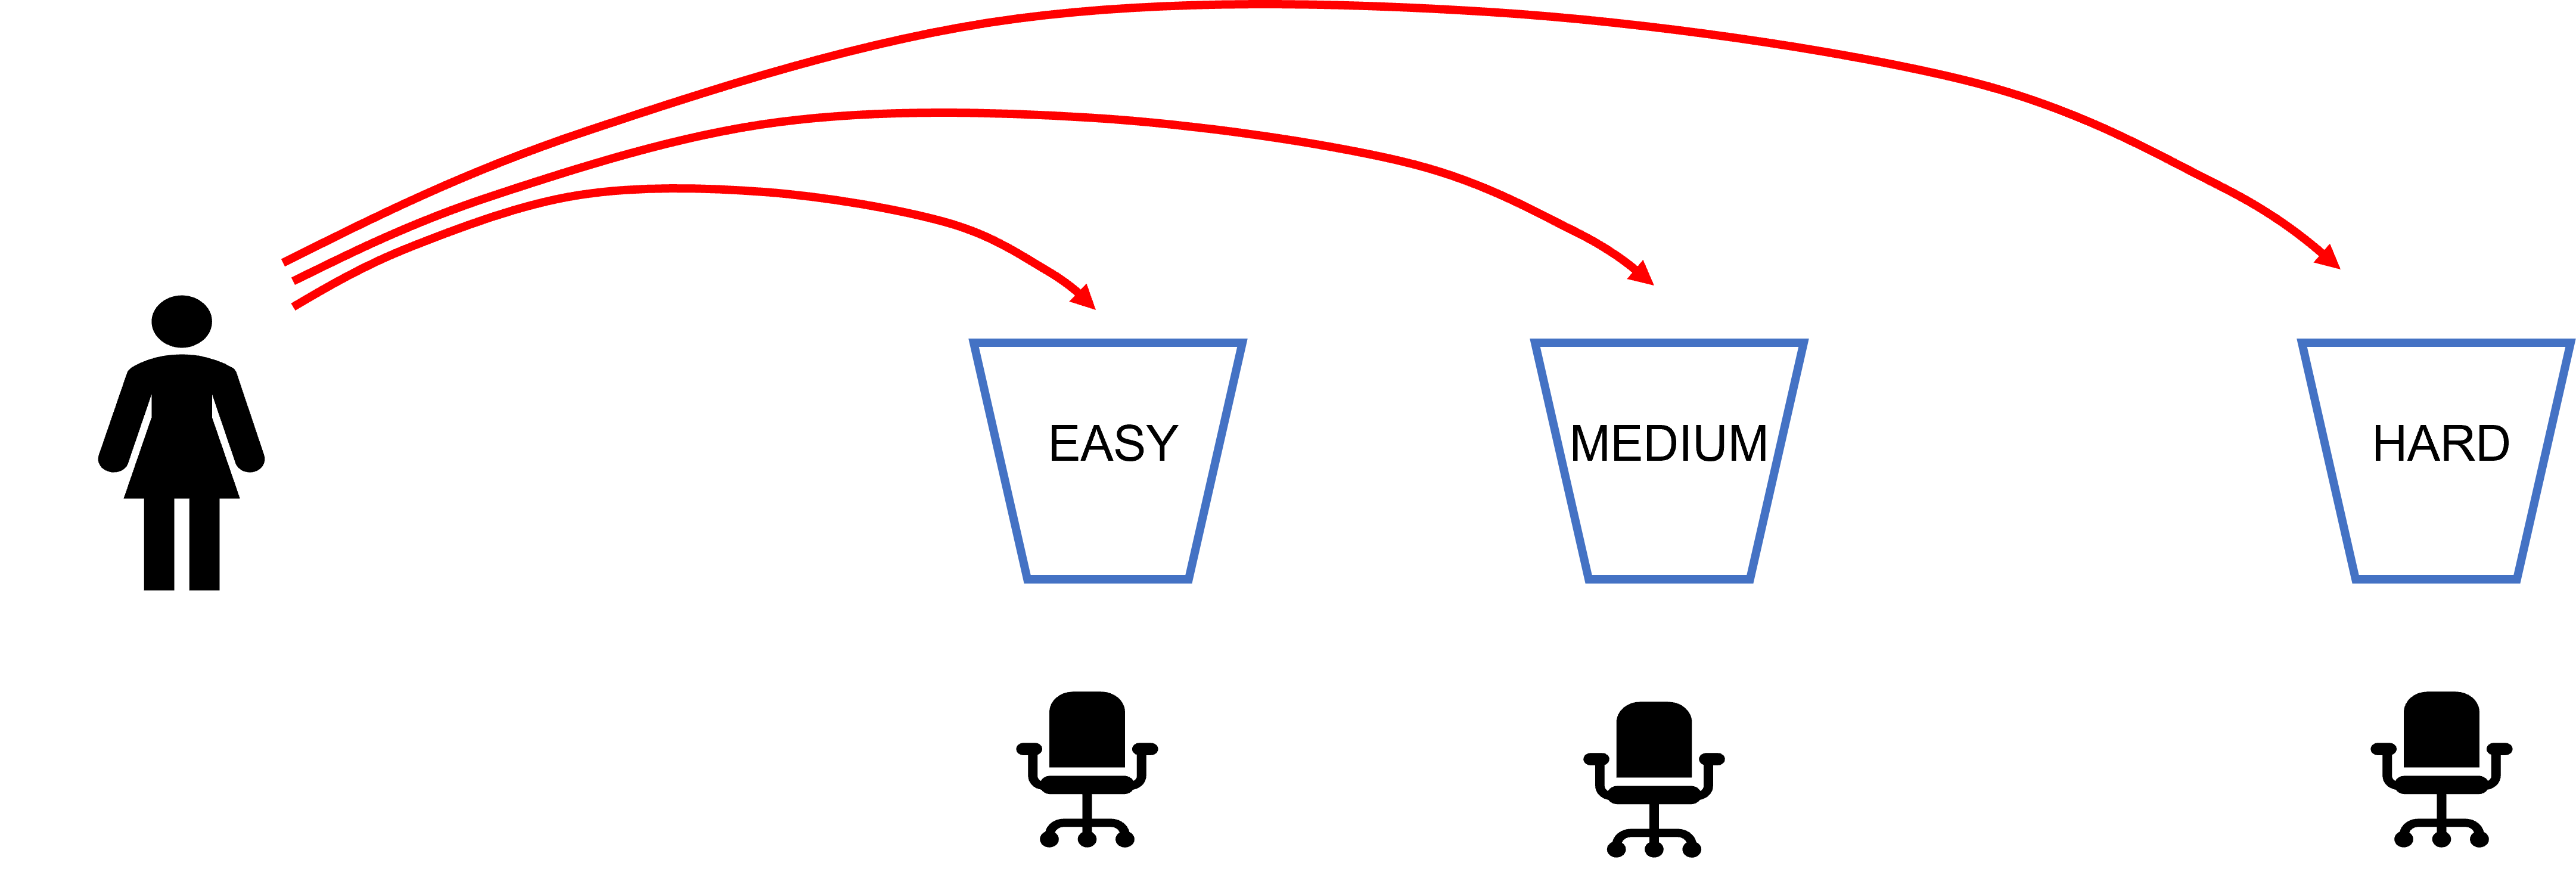
You need to set up the teams (or the overall class) as follows. Each team will throw their soft ball (or other item) at three targets – easy, medium, hard. The targets are the buckets or all chairs, and they need to be placed appropriately distanced apart. Obviously with easy the closest and hard the furthest away.
Initial Team Planning
Each team has a pretend $4m marketing budget and they have to plan their campaigns in ADVANCE. They will be running up to 20 campaigns, based upon this expenditure:
- easy campaigns = $100,000 each
- medium campaigns = $200,000 each
- hard campaigns = $400,000 each
Each team should look to spend their entire marketing budget, but will need to plan which types of campaigns they will be implementing BEFORE the game starts. To achieve this, you can allow each team practice time (that is, throwing their items at the targets) and planning time on how to allocate their marketing budget.
For example, their marketing budget could be:
- 4 easy campaigns = $400,000
- 8 medium campaigns = $1.6 million
- 5 hard campaigns = $2 million
- total campaign budget = $4 million
Please note the Excel template can be provided to each group to simplify their campaign planning, if required.
Playing the ROMI Game
Once each team has practiced and planned, the class can watch each group execute their plan. For each throw at their designated target, there are three possible outcomes:
- their throw goes into the bucket (or directly hits the seat of the chair) = BULLS-EYE = a highly successful campaign
- their throw the bids the edge of the bucket without going in (or hits another part of the chair = HIT = a break-even campaign
- their throw misses completely = MISS = an unsuccessful campaign
The template allows for the recording of the degree of success for each throw, until their marketing budget is exhausted.
You then repeat this process for each team. Usually there is 1-2 teams that substantially outperform the other teams, enabling a discussion of success factors, as per the student discussion questions below.
Scoring the Game
The scoring varies by the easy/medium/hard level of the campaign, as follows:
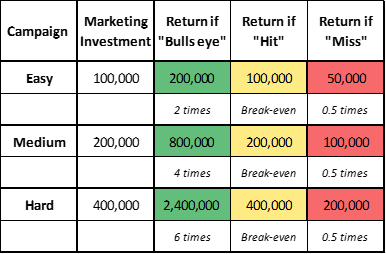
Again the template handles the scoring automatically – but as we can see:
- a “miss” only returns half of the marketing investment per campaign = a loss of 50% of the investment
- a “hit” returns the full marketing investment only = a breakeven campaign
- and a “bull’s-eye” returns 2 (for easy) or 4 (for medium) or 6 (for hard) times the campaign investment – this is designed to entice students towards the harder campaigns, which may/may not be in their best interests
Using the Excel Template
The template is very easy to use, and only the yellow cells need to be modified – which is the type of campaign and the degree of success achieved by the campaign.
Each team will plan their campaigns in advance of the total budget will be automatically calculated, along with their campaign results, as per this image:
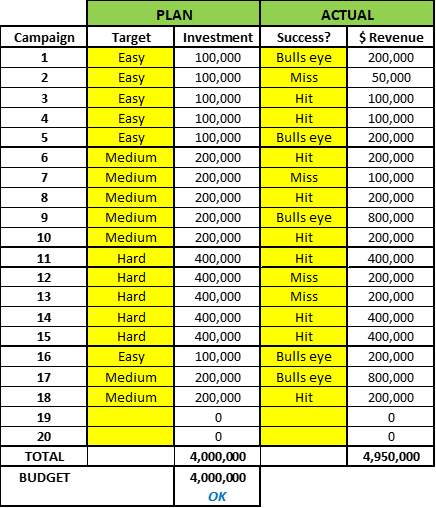
As you can see, there is an OK indication at the bottom of the budget, so you can quickly check whether or not the students a combination of campaigns fits within their marketing budget.
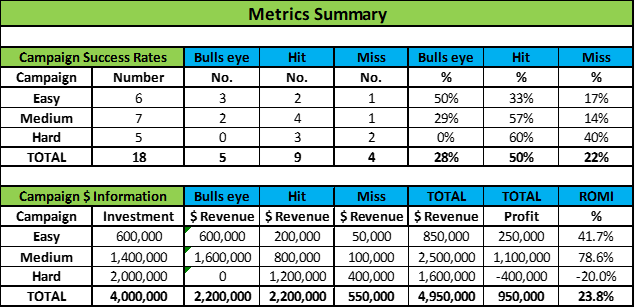
And on the right-hand side, as they progressively indicate their campaign results, their total revenue is also calculated. The template will automatically produce a table of outcomes, along with some summary charts as follows:
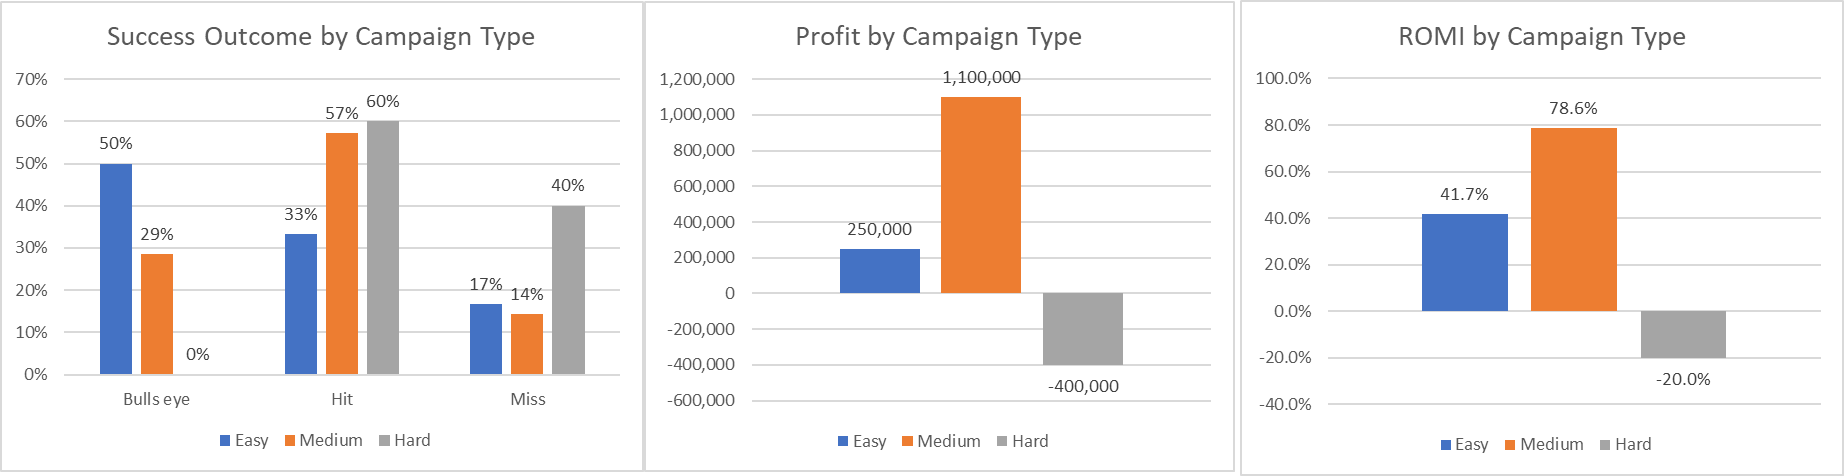
Student Discussion Questions
- Which campaign approach has the highest bulls eye (success rate)?
- Which campaign approach provides the best profit contribution?
- Which campaign approach has the highest ROMI?
- Which campaign metric would management pay the most attention to?
- Given answer above (Q4), are you more likely to focus on easy, medium, hard campaigns?
- Which is the most important metric to the success of the firm?
- Which metric did you try to improve for round 2? Why?
- Did you improve performance on all/some metrics?
NOTE: Round 2 is optional (see Q7 and Q8) – or can be played at another time.
Related Activities