Topics
game, decision-making, customer value, attributes, competition, teamwork, profits, SWOT
How the Customer Value Game Works
Quick Overview of the Game
- Key Learning Objectives: Customer value analysis (CVA), market segments and their needs, competitive strategy, financial outcomes, market analysis
- Number of student teams: From 2 to 10 teams
- Number of decision rounds: Up to 10 rounds can be played
- Number of market segments = Four underlying segments in the market
- Industry/market: Relatively generic – suitable for most student cohorts
- Key objective: To maximize profits by aligning the firm’s attributes to the needs of target markets
- Time to play: Approximately 15-20 minutes per round (up to 10 rounds)
- Complexity: Senior high school and university level students
- Instructor effort: Minimal, as game is automated – only simple decisions need to be entered
Getting Started
This game is played using an Excel spreadsheet, which tracks all the decisions and results.
- Download the Customer Value Analysis Game here: Customer-Value-Game-GITM
- Download the Student Decision Sheet here: CV Game Team Decision Sheet
- Please see VIDEO INSTRUCTIONS on how to run the game at the end of this page
When you open the game in Excel, you will see that there are five worksheet tabs, namely:
- Set-up = which enables you to rename the attributes, if required
- Decisions = where you enter each team’s decisions for the round
- Results = automatically produces sales and profit results each round
- Shares = automatically shows market shares by segment for each round
- Fit to Needs = determines how well each team’s attribute decisions fit the needs of each segment = which is important for students to understand the needs of the customers and to deliver better value
Let’s work through each of these tabs:
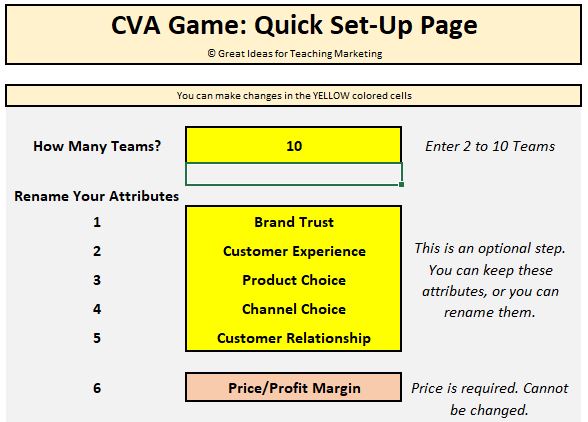
SET-UP
This is an OPTIONAL step. You don’t need to change this, but it can be used to tailor your game.
As you can see, you can choose to reduce the number of tens (team numbers will not be shown for clarity) and you can rename all or any of the attributes – except for Price/Profit Margin as this is used in the financial calculation.
Here is the screenshot for this tab:
DECISIONS
This is where you enter each team’s decisions. This is the only tab where you need to enter numbers. All the other tabs are automated.
As you can see – in the screenshot below – the six attribute scores for each team are required. These need to be scored in whole numbers anywhere from 1 to 10 only.
You cannot enter any other numbers – as the game will not let you. However, you need to ensure that you enter ALL six numbers for each team.
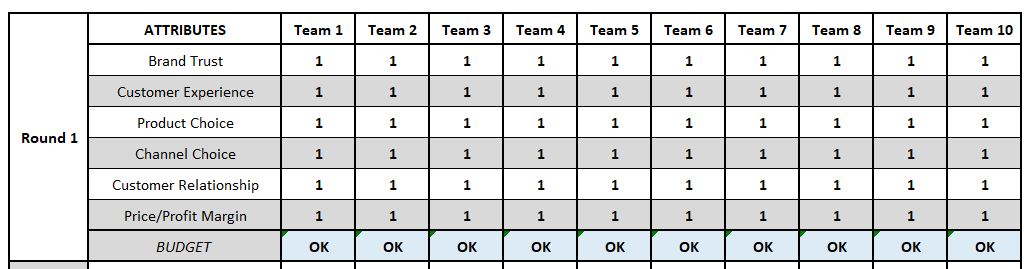
Each round is on the same tab – you just scroll down for Rounds 2 to 10.
You will note that there is a ‘Budget’ row. For each round, student teams can only change their total attribute points by a maximum of 10 points. As you can see, all attributes are set to 1 to start the game.
Let’s look at an OK budget decision and an OVER budget decision below.
- Team 1 got an “OK” – as they increased their scores by 0 + 4 + 1 + 2 + 1 + 2 = 10 points
- Team 2 got an “OVER” – as they increased their scores by 2 + 4 + 1 + 2 + 1 + 2 = 11 points
- In this case, Team 2 will need to revise their decision
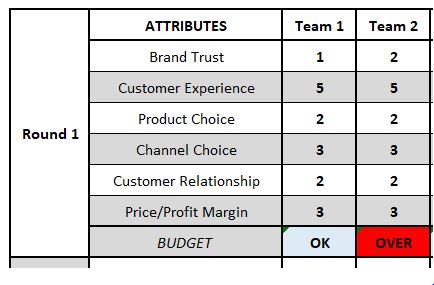
Remember that the change in attribute scores are compared to the team’s attribute scores from the previous round (or from 1 for Round 1 only) – and the change is counted – that is, either UP or DOWN, not just up.
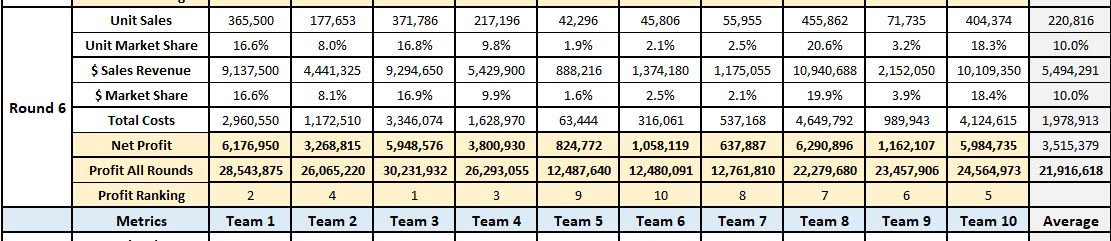
RESULTS
This tab automatically produces all the results – once all the decisions have been entered. Here is a list of the metrics provided for each round:
- Unit Sales = Number of unit sales by team – see note below
- Unit Market Share = Team’s % share of all unit sales
- $ Sales Revenue = Total sales revenue by team = see note below
- $ Market Share = Team’s % share of all $ sales
- Total Costs = Total costs (fixed and variable) for each team – see note below
- Net Profit = Sales Revenue less Total Costs
- Profit All Rounds = Total of all Net Profits = the KEY METRIC
- Profit Ranking = Ranking of teams for the Profit All Rounds
Some key notes to the above metrics:
- Unit Sales = Sales are calculated by the game on a per segment basis – the better that the team meets the needs of the segment (that is, a better ‘fit to needs’ of meeting customer value) – then the more sales the team gets from that segment. Their total unit sales are the sales that they win from each of the four market segments.
- $ Sales Revenue = Revenue is unit sales (above) multiplied by the team’s price. While the teams do not set an exact price, it is estimated from their Price/Profit Margin attribute score. So the higher they set this attribute, the higher their price. But note: setting a price/margin too high is likely to reduce unit sales.
- Total Costs = Total Costs are based upon unit sales (above) multiplied by cost per unit – which is determined by the settings of all the team’s attribute scores (except for price). Therefore, the higher a team sets their attributes, the higher their cost per unit will become.
Here is a screenshot of the Results tab…
SHARES
The Shares tab shows the market share for each team by segment. This is very helpful information for your students, as it indicates where they are performing well.
Please note that the game has been structured – like in real life – that the four underlying market segments all have differing needs. It is difficult for teams to have a “mass market” offering and be successful. This makes the game a good tool for understanding target market assessment and selection as well.
This tab is color-coded to improve readability, where green has the highest market shares and red is the lowest. Here is the screenshot example…
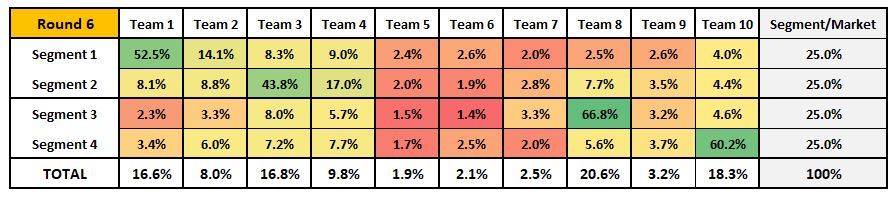
Note: Each segment represents 25% of the market’s sales (last column to the right).
And in this example above, you can easily see the teams that have selected a segment to target and are achieving success in that regard, as:
- Team 1 = Segment 1
- Team 3 = Segment 2
- Team 8 = Segment 3
- Team 10 = Segment 4
Their total market shares are shown at the bottom – and as can be seen – these four teams are also the best performing overall teams (with total market shares ranging from 16.6% to 20.6%).
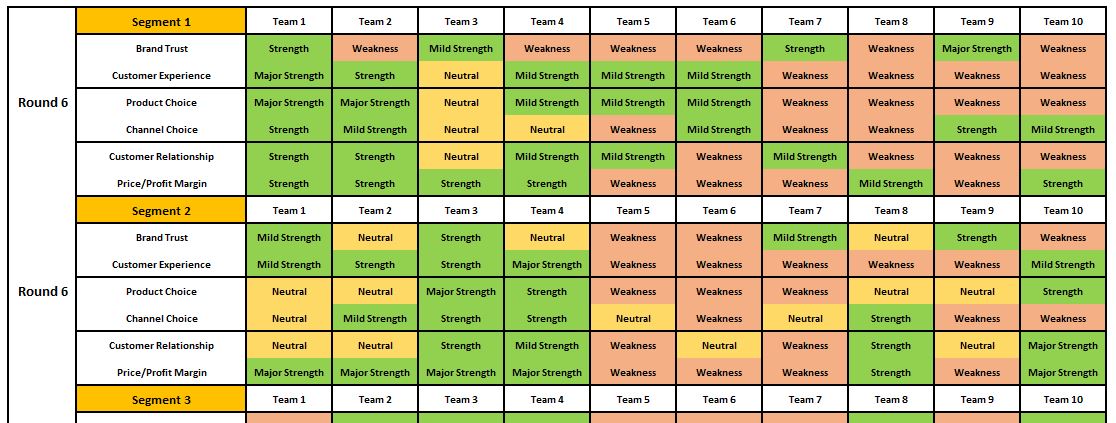
FIT TO NEEDS
The final tab is Fit to Needs. This is also an important tab for students to understand how well they are providing customer value and meeting customer needs.
This tab has been built around strengths and weaknesses – and provides information for each segment individually.
The information is very important for students to identify how well their offering is meeting needs, using the following rating system:
- Major Strength = The attribute score is a strong match to the segment’s needs and preferences
- Strength = The attribute score is a good match to the segment’s needs and preferences
- Mild Strength = The attribute score is a reasonable match to the segment’s needs and preferences
- Neutral = The attribute score is a weak match to the segment’s needs and preferences
- Weakness = The attribute score is a very poor match to the segment’s needs and preferences
Students teams should use this SWOT-style information, plus the additional information in Market Shares and Financial Results to guide their decision making.
Here is an example screenshot for the Fit to Needs tab…
Video Instructions for Educators
Video Instructions for Students
Related Games and Information