Topics
positioning, perceptual maps
Teaching Notes
- Preferred format: This teaching activity is designed for individual students to create the perceptual maps and then for small groups to discuss the interpretation.
- Student audience: Could be run with any level of marketing student, perhaps more suitable for students of introductory marketing, as well as students of marketing strategy.
- Exercise time: Given the students need to develop three different perceptual maps, plus group discussion time, around 20-30 minutes would need to be allocated for this activity.
- Activity variations: You could get the students to create their own numbers to input (based on research) or add extra competitors.
- Download the perceptual mapping template: free_download_perceptual_map_template
- Optional Instruction Video: At the bottom of the page.
Review the activity below or download the PDF student worksheet
- Student Worksheet: Creating and Interpreting a Perceptual Map
- Instructor Solutions (Members Only): Creating and Interpreting a Perceptual Map = Solutions
Student Discussion Activity
Let’s Make Some Perceptual Maps
For this marketing exercise you need to create and then interpret three perceptual maps for fast food chains.
In order to create the perceptual maps, your instructor will provide you with an easy-to-use Excel perceptual mapping template.
Your three maps will be:
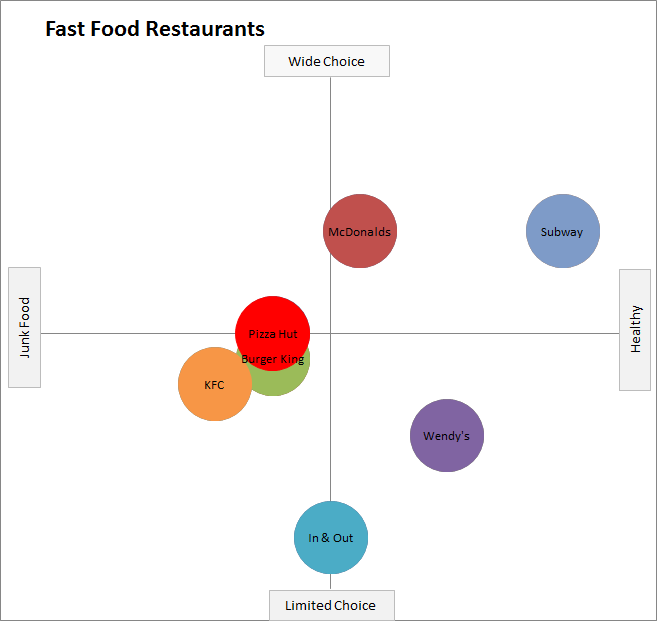
- Healthy/Junk Food vs Wide/Limited Choice
- Healthy/Junk Food vs For Adults/Kids
- Wide/Limited Choice vs For Adults/Kids
Here is the data required to input into the template in order to create your three fast food perceptual maps. Once you have created your three maps, address the discussion questions underneath.
Healthy Food (9) Junk Food (1)
- McDonalds = 5.5
- Burger King = 4
- Wendy’s = 7
- In & Out = 5
- KFC = 3
- Subway = 9
- Pizza Hut = 4
Wide Choice (9) Limited Choice (1)
- McDonalds = 7
- Burger King = 4.5
- Wendy’s = 3
- In & Out = 1
- KFC = 4
- Subway = 7
- Pizza Hut = 5
For Adults (9) For kids (1)
- McDonalds = 3
- Burger King= 6
- Wendy’s = 7
- In & Out = 8
- KFC = 4
- Subway = 8
- Pizza Hut = 4
Here is an example of the first perceptual map that you need to create to use as a check. Don’t worry about the colors, but the locations/positions of the circles – and the axis labels – should be the same.
Student Discussion Questions
- Recreate the above perceptual map using the above data and attributes.
- Create two more perceptual maps using the above data – that is, healthy food and adults attribute scores and then wide choice adults attribute scores.
- By referring to these three perceptual maps, what conclusions can you draw regarding the positions of these competitors in the fast food market?
- What opportunities exist for repositioning?
- What opportunities exist for potential new entrants?
- What other attributes might be worthwhile in plotting onto a perceptual map?