Topics
segmentation, cluster analysis, target markets, analysis, marketing research
Teaching Notes
This activity is based around a free Excel template for quickly and easily running cluster analysis. Please note that this template requires students to have some confidence with Excel, as they will need to select the Solver Add-in for the clustering template to run. However, the template itself is easy to use and is a helpful way of showing students how cluster analysis can be used in market segmentation.
By using the free template (see download link below) – students will be able to run cluster analysis simply by entering the data and then viewing the automatic output and graphs. Ideal for all marketing students, as there is no need to teach them SPSS or programming.
Review the activity below or download the PDF student worksheet
- Student Worksheet: Fun Approach to Cluster Analysis
- Instructor Solutions (Members Only): Fun Approach to Cluster Analysis = Solutions
- Here is the free download of the Excel cluster analysis template to share with your students: cluster-analysis-marketing-free-template-zip-file
- Note: The Excel template is in Zip file format, as it contains a macro.
Additional information: Please see this page for instructions on how to use the template – or see the video instructions below, which can be shown to students.
Student Activity
Your teacher will provide you with access to an Excel template for running cluster analysis. Our goal is to convert customer data (from a survey or from a customer database) into market segments, in order to help us better understand the market and ultimately identify our best target market/s for our firm.
Here are the steps to save and get started with the template.
- Save the ZIP file – open/extract the Excel template
- Open the Excel file – please note that only Excel 2010 or later versions will be able to run the calculations
- Click to enable editing.
- Click to enable macros (click the ‘enable content’ icon).
- Add in Excel Solver (if required) – please see full instructions in the spreadsheet template.
No password is required for the template to run
You will note that key cells have been protected in Excel to ensure that the template runs without errors, but the template works without a password. If you are prompted for one, it is because you have tried to type over a formula or a protected cell.
Your Task
Your task to enter some hypothetical (or real if you have it) data for consumers. Enter data for at least ten consumers and at least two marketing variables. Please see this list for ideas on potential marketing variables:
- Level of customer satisfaction
- Brand awareness levels
- Loyalty – switching behavior
- Various attitudes to brand/s (you could incorporate results from an image survey)
- Various attitudes (agree/disagree) to general life issues (measuring their values)
- Degree of high/low purchase involvement in decisions
- Heavy – light usage levels
- Recency and frequency of purchase
- Importance of price in the purchase decision
- Importance of advertising to the consumer (degree of influence)
- Level of media consumption
- Use of opinion leaders and word-of-mouth for information
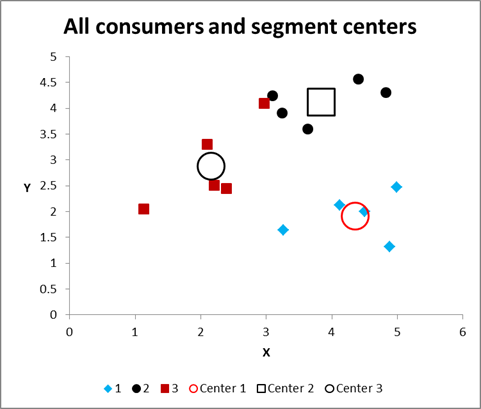
Then review the output – some examples are shown below – for the main graphs and tables automatically produced by the spreadsheet. (Please note that these examples are from different segmentation approaches – that is, they use different data).
Get a sense of the various market segments and their “needs” – based upon the marketing variables that you gave chosen to use.

Student Discussion Questions
Play around with the marketing (input) variables – change, add, delete and review the changes – and then answer:
- How do the variables change the segments?
- Which types of marketing variables seem to work best – provide more effective segments?
- Which is your best market segmentation approach from your various “tests”? Why?
- How do you think that cluster analysis works?
- What do you think are the pros and cons of this type of approach to market segmentation?