Topics
customer relationship management, marketing mix, strategy, B2B markets, micro-environment
Teaching Notes
Please note that there is a non-interactive version of this Sim Game available, which may be suitable for some classes to play first, before progressing to physical trading.
Here is a PowerPoint pack (that you can edit if required), to present to students on how the game works: Interactive Marketing (Trading) Game. And please see spreadsheet link below in “Requirements”.
Overview of the Interactive Marketing Game
This is a free marketing game that requires students working in teams to determine their 4P’s and trade with other teams in order to maximize profits over several decision rounds.
This is a very effective learning exercise for getting students engaged as it is highly competitive as well as a fun, social activity. It is ideal for early in the semester/term – to also act as an icebreaker – or for when groups are established and are working well.
Requirements
- At least nine student teams (up to 15 teams)
- A scoring and planning spreadsheet (download the interactive marketing game 2020) – and at least one student per team that has access to Excel (or other suitable spreadsheet software)
- Some form of pretend money = such as: poker chips, tokens, Monopoly money
- Some form of pretend products = such as Lego bricks or buttons
- You need to allow 1.5 to 3 hours (depending on student level, plus debrief/discussion time) – but it can be played over several sessions.
Step-by-Step Guide to the Interactive Marketing Game
Step 1 = Get Organized
Organize the students into a suitable number of teams. We need at least three teams of MANUFACTURERS and at least six teams of RETAILERS. This makes a minimum of nine teams in all. If you have more teams, then you can increase the number of manufacturers up to six teams. For the retailer teams you will need to further allocate these groups to be a specific type of retailer, as follows:
- A discount retailer
- A general specialty store
- A high-end specialty store
This market structure is why we need the retailer teams to be organized in sets of three.
Step 2 = Explain the Rules of the Game
Take adequate time (depending on your students) to explain the “rules” of the marketing game to both the manufacturer and the retailer teams, as their roles differ somewhat.
Rules for Manufacturers You are a manufacturer of shoes. To keep it simple, you have the ability to manufacture three different product lines of shoes, from low quality to high quality. In the planning spreadsheet, these product lines are shown as:
- L1 = Level 1 = basic quality
- L2 = Level 2 = medium quality
- L3 = Level 3 = high quality
It is up to you which product lines that you choose to manufacture. You may manufacture one, two, or all three product lines. And you may modify your product mix each round if you choose. This is your product decision in the 4P’s. There are multiple factors that will influence your product mix decision, these are:
- Market demand (see more details below)
- Retailer relationships
- Supply costs (see more details below) and
- What price you can achieve for your products
Market demand and supply costs are known and are given to you (on the spreadsheet), but retailer relationships and your negotiated price/s (and therefore your profit margin) will only unfold during the game itself, and will most likely change over time.
During the trading part of the game, after you have made your product mix decision for the round, you need to negotiate and make deals with relevant retailer teams.
You agree prices with the retailing teams – that’s up to your persuasive selling skills. So in this part of the game, you need to think about the other marketing P’s = setting prices, which retailers (place and logistics), and selling and building relationships (promotion).
Rules for Retailers You are a retailer that sells shoes as part of your merchandise offering. Your retail format is fixed for the duration of the game – and you have been designated as either a:
- Discount retailer
- General specialty store, or a
- High-end specialty store
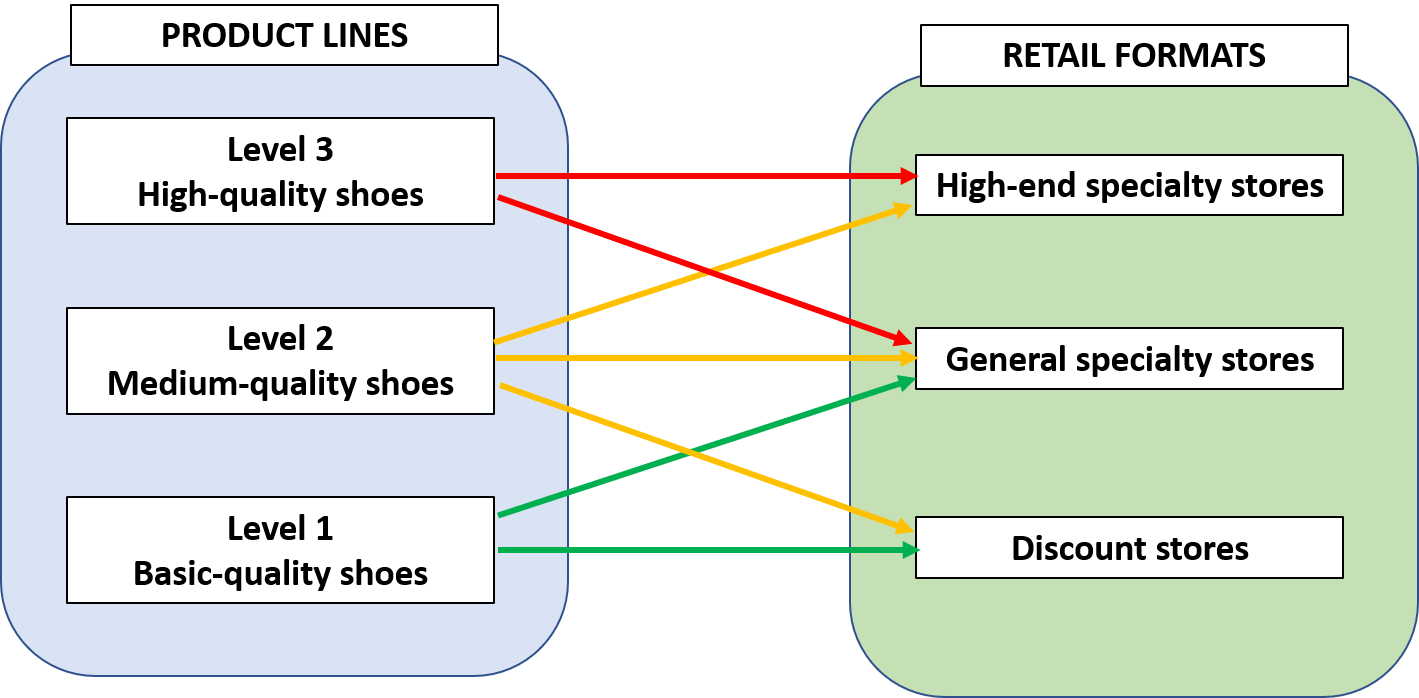
You can buy shoes from any of manufacturing teams, at a price that you agree upon with the trading team. The only restriction is that you must buy the quality level shoes that fit with your brand and retail format, as follows:
- Discount retailer = you can only buy and resell Level 1 (basic quality) and Level 2 (medium quality) shoes
- General specialty store = you have no restrictions and can buy all three quality levels
- High-end specialty store = you can only buy and resell Level 2 (medium quality) shoes and Level 3 (high quality) shoes
These trading relationships are show here:
Please note that you are NOT required to buy the two (or three) different product lines (as above), but it is helpful in making profits.
Step 3 = Get to Know the Spreadsheet for the Game
The spreadsheet game is provided free (interactive marketing game 2020). The file runs on Excel (or similar software). There are no macros and the non-data cells have been protected so that students cannot “break” the formulas.
Key Spreadsheet Components In the bottom tabs, you will see four sheets, as shown here:
![]()
Let’s work through each of the tabs.
The easiest tab is Manu Costs, which is just a information graph for the manufacturers and is looks like this:
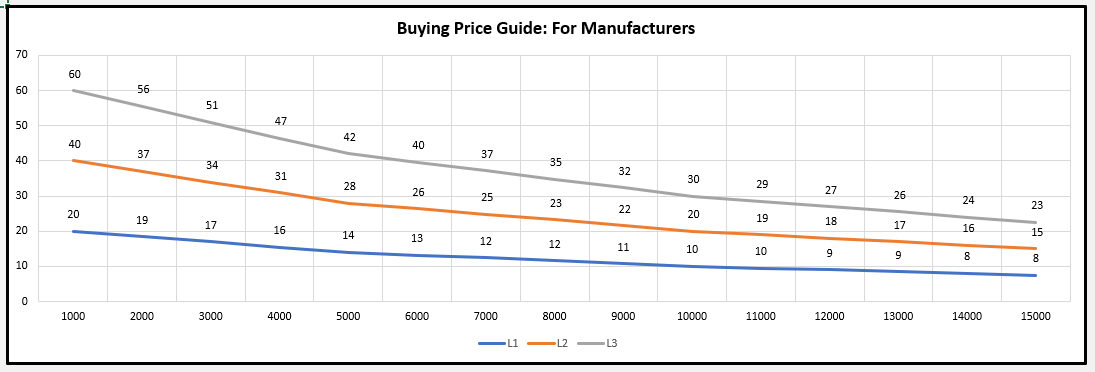
This is the supply cost for the manufacturers’ raw materials to produce the shoes, in lots of 1,000 units. As you can see, there is an incentive to purchase in higher quantities. For example, if a manufacturer wanted to purchase enough raw materials to produce 1,000 level-one (L1) quality shoes, then they would pay $20/unit = $20,000 for a 1,000 unit supply.
However, if they bought 5,000 units at one time, then their unit cost would drop to $14/unit = $70,000 for a 5,000 unit supply. The chart also shows the unit cost structure for the other two quality levels as well. So this worksheet just provides simple information.
The first tab is titled Manufacturers. It is designed as a planning tool for the manufacturing teams prior to the interactive trading part of the rounds. It looks like this…
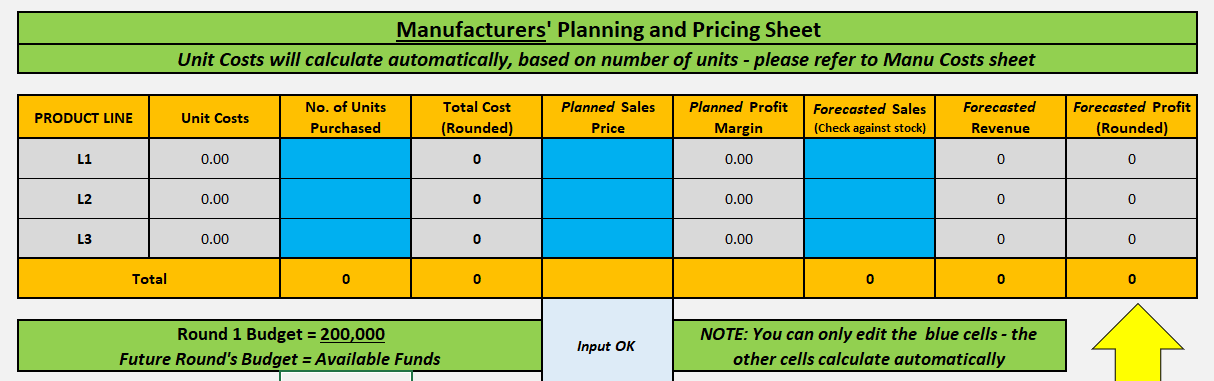
Please note the three blue columns. These are the only cells that students need to use. The other cells calculate automatically. If there is missing data, the spreadsheet will read “Check Input Data” at the bottom, so it is helpful for students in case they miss a cell when revising decisions. The students’ key objective is to maximize profits over time. So this is a helpful sheet for planning.
There are multiple decisions to make:
- A key decision is which product line/s to manufacture (which may evolve over the course of the game).
- Then they need to decide the quantity of each product line to purchase and produce. At the start of the game they have no inventory, but are likely to build inventory (products not sold to retailers), so that will influence their quantity decisions. And, of course, their average unit cost drops with larger quantities.
- Then they need to estimate what average price they will achieve in their negotiations with retailers. This might be a guess in the early rounds, but will be based on market experience and relationships later in the game.
- And finally, they need to estimate their likely sales to retailers (again based on guesses and market experience0.
They need to remember that they are competing against other manufacturing teams in terms of profitability over time. And this part of the spreadsheet (and game) is a planning exercise – it is then up to them to then execute their plan as best as possible. Here is an example of a completed planning sheet for a manufacturer.
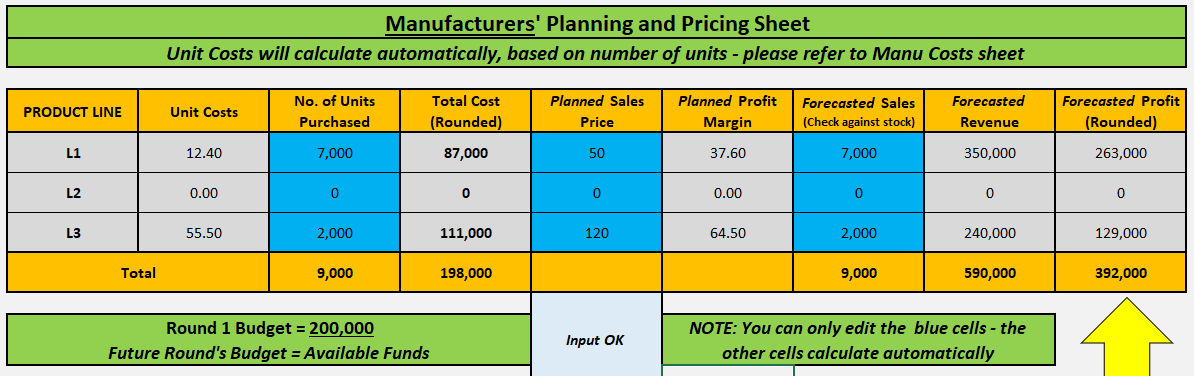
In this first round example, this manufacturing team has decided to produce two products lines = L1 and L3. As you can see, the unit cost (as per the previous graph) calculates automatically. They then estimate what average price that they can sell the produced units (shoes) to the retailers and how much they will sell. In this case, it they successfully execute their plan, then they will make $392,000 in profits for the round.
You will note at the bottom left of the spreadsheet that each manufacturing team starts with $200,000 to purchase stock (production/distribution is free for simplicity in the game) – so whatever they purchase as stock immediately transforms into the finished product ready for sale to retailers.
Over time, as their profits grow, manufacturers can purchase as many units as they can afford, based on their accumulated profits.
The next tab is titled Retailers – and this is the equivalent planning tool for the retailing teams. It even looks somewhat similar, like this…
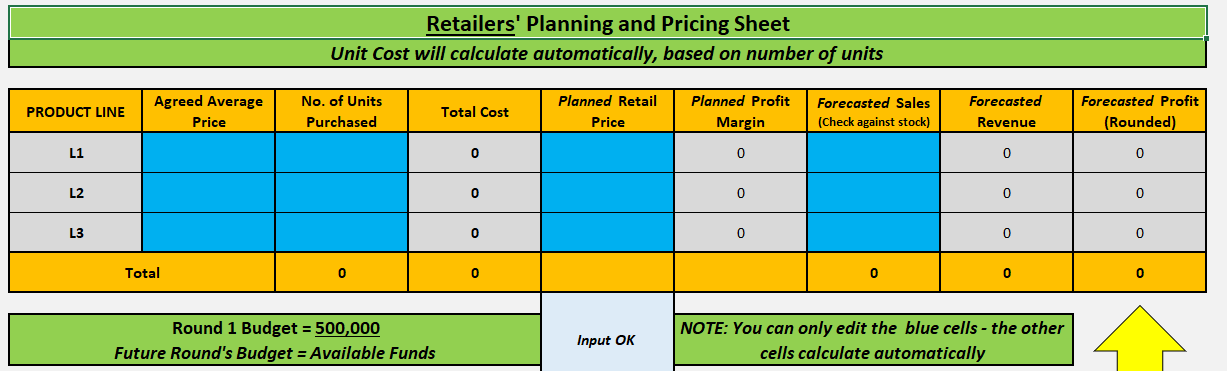
In this case, the retailing teams have four columns to complete and also have the “Input OK” indicator at the bottom, as a key that all the data has been entered. Retailers need to remember that they may be restricted from buying certain product lines that either do not fit with their brand or their target market.
As a reminder, high-end specialty stores do not want L1 (basic) quality products in their stores, and discounters would not have the target market to sell L3 (high) quality products to their customers.
Like with the manufacturers’ sheet, this is a planning tool for a team planning session prior to the interactive trading activity each round. Here is an example of a completed planning sheet for a discounter…
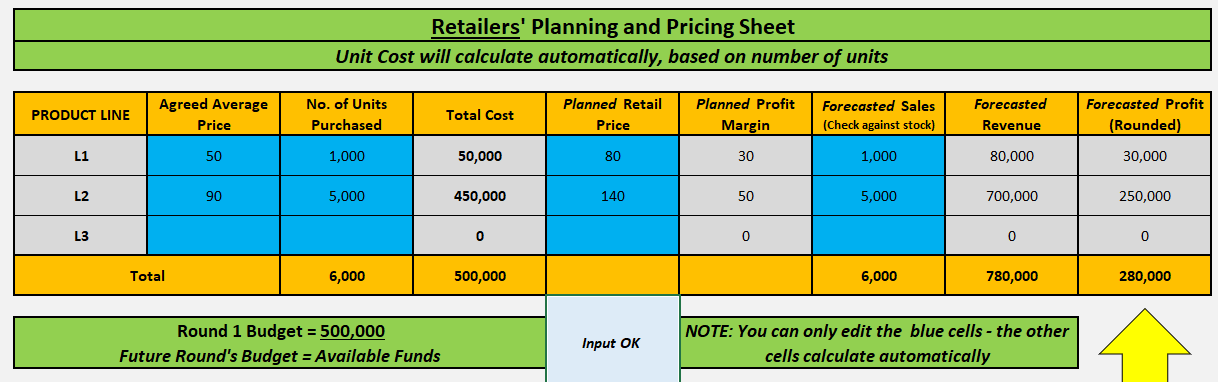
As a discount chain, they are limited to L1 and L2 product lines only. This team’s emphasis will be on L2 – where they plan to buy 5,000 units at an average price of $90/unit. They will also offer a small selection of L1 quality – hoping to acquire 1,000 at price of A$50/unit. They also need to estimate how many units they will resell at the retail level.
These four inputs per product line gives them a planned profit of $280,000. Please note that retailers start with a larger budget in round one of $500,000 and that they are competing against other retailers. Additionally, when using the spreadsheet, you will see that some of the numbers are rounded to the nearest thousand – which is to help simplify the numbers for the students.
The final tab is titled Retail Sales, and looks like this…
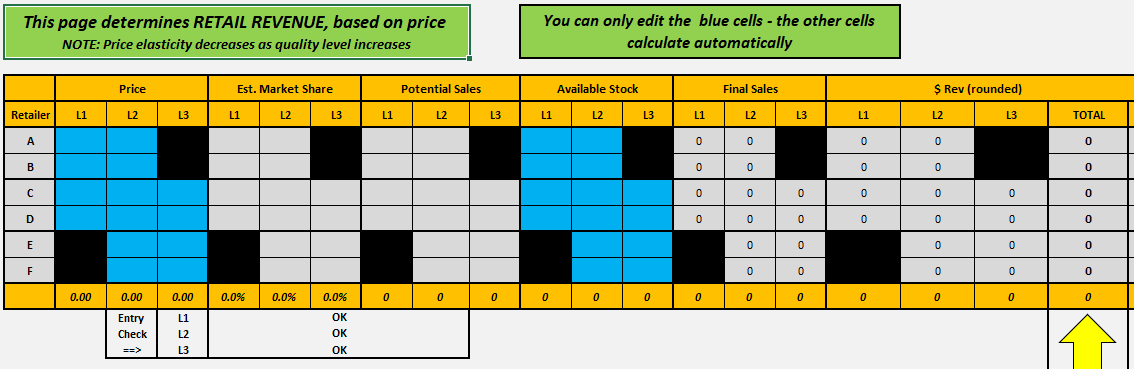
This final tab is designed for lecturer/teacher use. It is used at the end of the trading for the round to determine retail sales and revenue for each retailing team. Again, we only need to enter data in the blue cells.
At the end of each trading session, each of the retailing teams will advise you how many L1, L2 and L3 product units that they have for sale in their stores (= available stock), as well as letting you know what retail price they have set for each product line.
L1 products are reasonably price elastic and can have a final retail price of $50 to $100 only. L2 products are somewhat price elastic and can have a final retail price of $100 to $150 only. L3 products are generally price inelastic and can have a final retail price of $150 to $200 only. The spreadsheet calculates this for you – here is an example of a completed Retail Sales sheet…
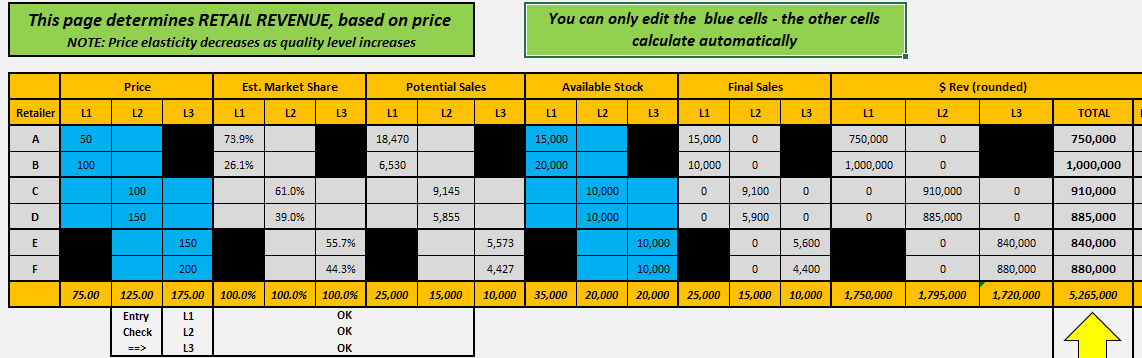
In this case, Retailers A + B (discounters), C + D (general specialty), and E +F (high-end specialty) are shown in direct competition to help highlight the price effect. In all three competitive sets, the first team has opted for the lowest price and the other team has used the maximum price possible.
As you can see, the difference between ‘Final Sales’ between each competitive set is the highest in L1 and at the lowest in L3. We then use this to determine how many units (of each product line) that each retailer has sold in the marketplace and how much revenue that they have gained.
Step 4 = Understand the Financial and Sales Limits of the Game
In order to simplify the game, the market demand at the retail level has been fixed for each round, as follows:
- L1 products = total retail sales = 25,000 units per round
- L2 products = total retail sales = 15,000 units per round
- L3 products = total retail sales = 10,000 units per round
- TOTAL market demand per round = 50,000 (from L1, L2 + L3)
These sales are shared across all retailers – not each retailer. And the retail price is set within a fixed range each round, as follows:
- L1 products = final retail price of $50 to $100 only
- L2 products = final retail price of $100 to $150 only
- L3 products = final retail price of $150 to $200 only
The initial raw material unit cost, as paid by the manufacturers varies by quantity purchased, but will be in the range of:
- L1 raw materials = from $5 to $20 (less for larger orders)
- L2 products = from $10 to $40 (less for larger orders)
- L3 products = from $15 to $60 (less for larger orders)
All these market constraints are automatically built into the game’s spreadsheet. These various financial factors: unit costs, potential retail prices, and market demand (per product line) – provides valuable information for assessing the attractiveness of different opportunities.
Step 5 = Let’s Play the Game
Each retail team should receive $500,000 in pretend money for their starting capital (budget), and each manufacturing team should receive $200,000 in pretend money.
All of the teams should have access to the Excel spreadsheet for the game. Teams then spend some time (say 15 minutes) in planning mode, working out their approach and planning on the spreadsheet.
When ready, each manufacturing team needs to go to the instructor and purchase raw materials (products) as per their plan. The products need to be in three varieties (to represent 1,000 units of L1, L2 and L3) – these will be the Lego bricks or other tokens easily recognizable.
Once all manufacturers have paid for (handed over money) and received their stock, the trading part of the game can begin (again, another 15 minutes or so for the first round). In this interactive trading session, manufacturer and retail teams need to meet, discuss and try to negotiate deals. This will usually include bartering, special deals for larger quantities, trading off deals, and so on.
In some cases, a deal cannot be struck, so the teams need to consider relationships with other teams at that stage. If a deal is struck, then the manufacturer physically hands over the quantity purchased to the retailer and the retailer pays the pretend money to the manufacturer.
After a time limit, the trading round ends. It may be possible that some teams did not strike any deals at all in the time period – which can happen if teams bargain too hard or too little. Then the retailers let the instructor know their proposed retail price per product line and the quantity of their available stock.
The instructor enters this information into the Retail Sales tab of the spreadsheet (as describe above). Depending on the outcomes from the spreadsheet, the instructor pays each retailing team their earned revenue and takes the appropriate number of product units from them.
It is likely that most teams will have stock leftover (inventory) at the end of each round, which they can hold and use for the next round. Each team is holding their own pretend cash so they can work out how much money they have and how much profit they made. Then the game simply repeats.
Teams go back into planning again – but now they have market knowledge, possible alliances and relationships, different capital (budget) and inventory situations. So each planning session should be somewhat different as their market environment has changed.
The game continues for a number of rounds – depending on available time – but note that after students get the hang of the game, the interactive trading sessions become faster and more efficient. At the end of the game, the money held by each team is counted (and verified) – and then deduct the starting capital of $200,000 (manufacturers) or $500,000 (retailers) to determine net profit for the game.
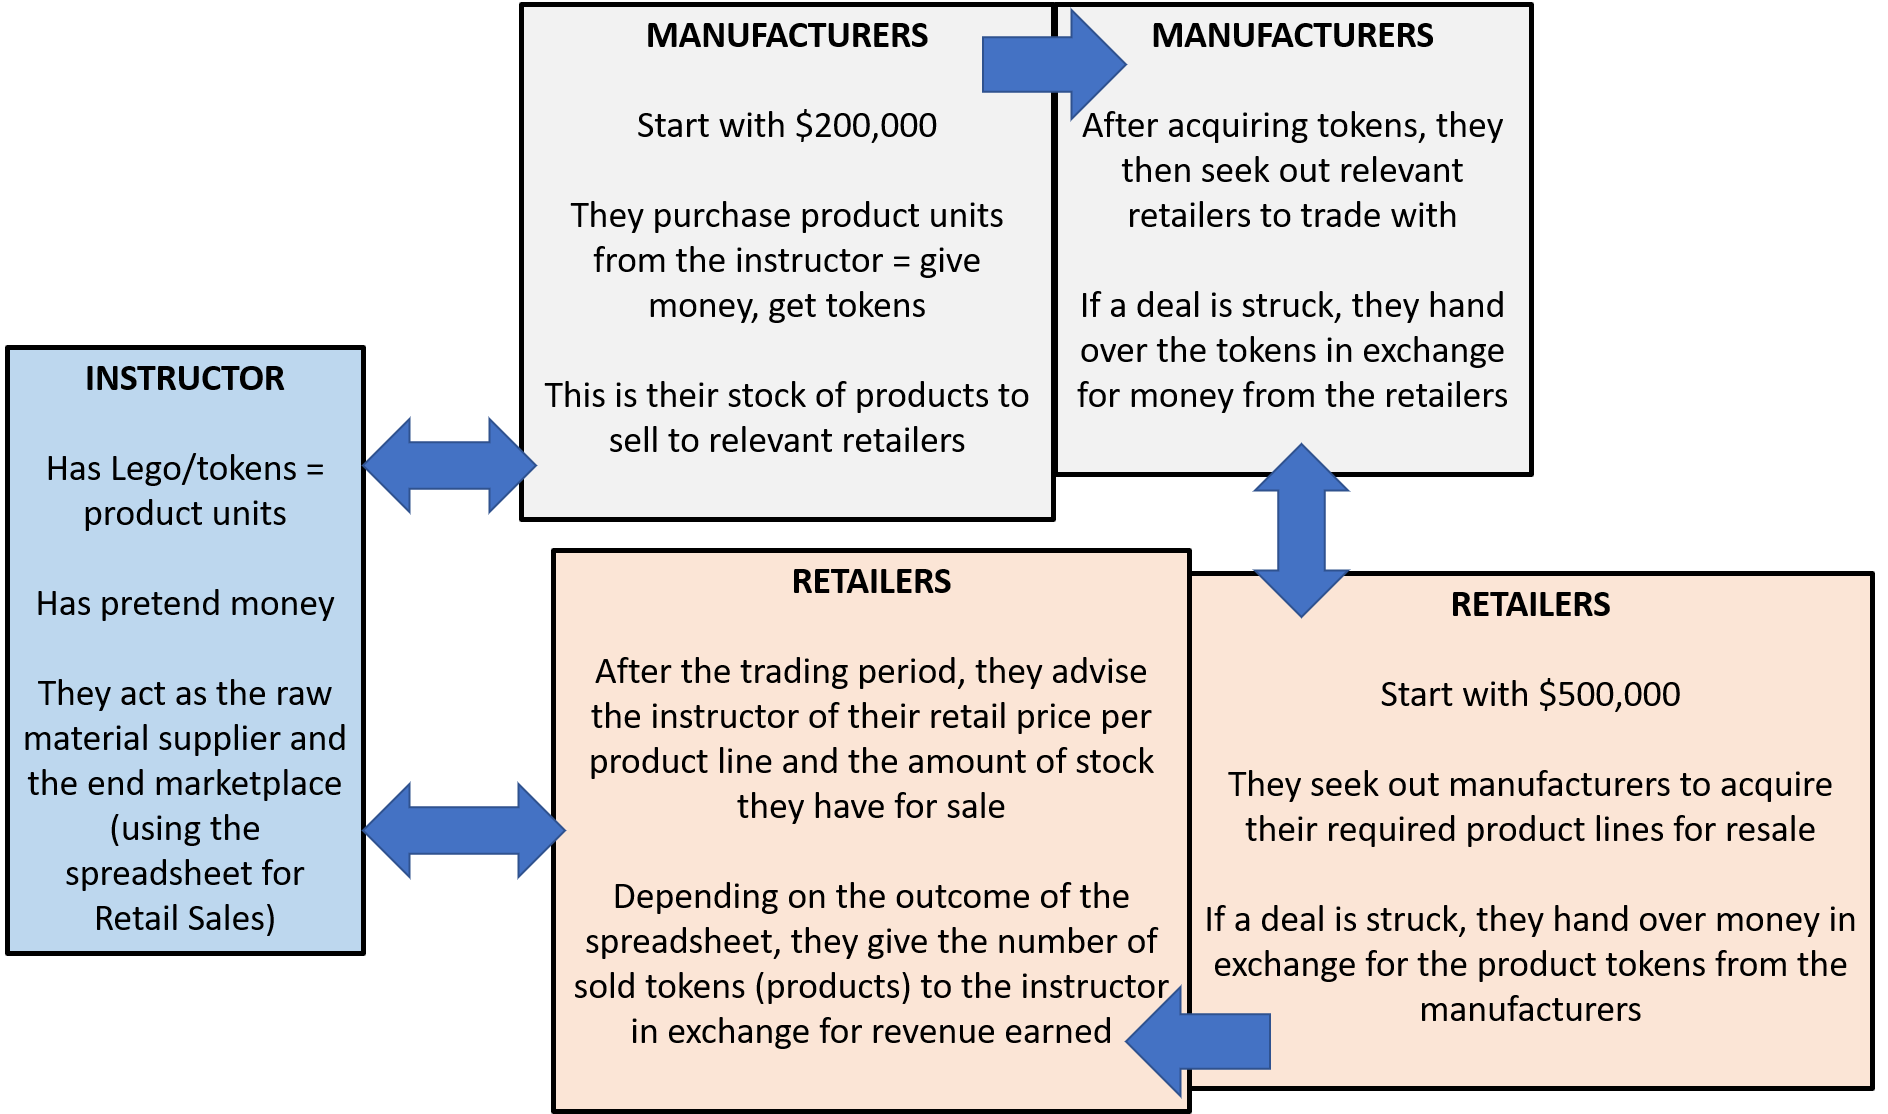
Remember that manufacturers are competing against other manufacturers and retailers against other retailers. Here is a visual representation of the game overall…
Step 6 = Debrief and Discussion
The students in this interactive marketing game have created and operated in a market. The manufacturers all started in exactly the same position, and the retailers either had an advantage of more turnover (for discounters) or more profit margin (for high-end specialty) or more product lines (for general specialty).
So there are a number of discussion questions that we could pose…
- Why is there such a difference in profitability between teams over time?
- What are the key success factors in this market simulation?
- Which are the most important P’s in the 4P’s?
- Did some teams have an advantage? Why?
- Who has more market power – manufacturers or retailers?
- Are alliances and relationships important?
- And, what did we learn about marketing with this exercise?
Final Tips for Instructors
- Get familiar with the spreadsheet and how it works – it is easy to use, but students will have some questions/problems is they are new to Excel
- Make sure that you have enough pretend money – photocopy extras if required – and the money should be in 1,000, 10,000, 100,000 and 1,000,000 denominations
- Make sure you have enough product tokens – we need three different types for L1, L2 and L3
- If you have a larger class – get a teaching assistant or student to assist you – as sometimes teams need money change within the trading sessions
- And finally, take your time with the instructions – like any game, easy to play once you get going, but some uncertainty at first