Topics
market segmentation, analysis, market research
Teaching Notes
This activity introduces marketing students to the concept of forming market segments using consumer data. It is a very helpful technique for reinforcing that segments need to be similar in needs (homogeneous), yet distinctive from other market segments.
Because the activity is essentially visual in nature, it appeals to a broad range of students – and it is generally fun and engaging to run. With wrap-up class discussion, it should run around 30 minutes.
Review the activity below or download the PDF student worksheet
- Student Worksheet: Using Scatter Charts for Market Segments
- Instructor Solutions (Members Only): Using Scatter Charts for Market Segments = Solutions
Additional resources: All the graphs have been produced from a free Excel cluster analysis template available here… cluster-analysis-marketing-free-template-ZIP-file
Related Activity: Please see this activity, starting point for using the above clustering template = Fun Approach to Cluster Analysis
Student Activity
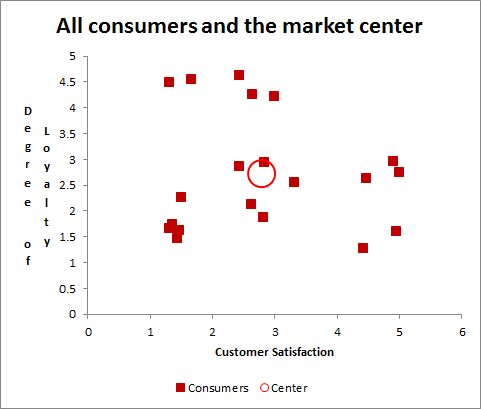
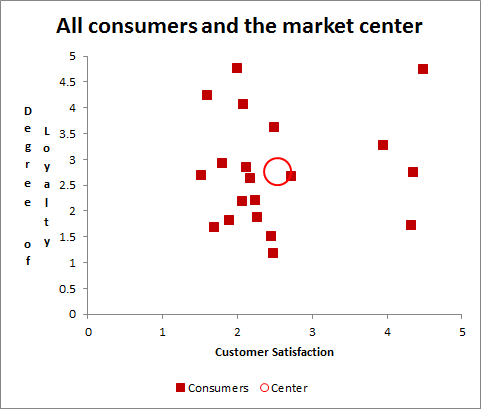
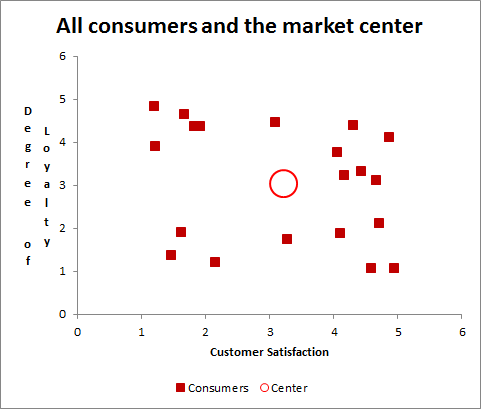
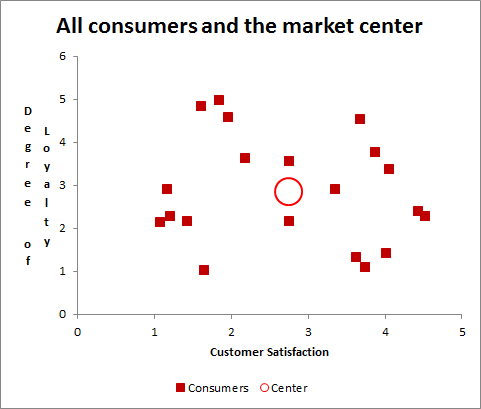
Below are a series of scatter charts showing customers’ “customer satisfaction” (CSAT) and “loyalty” scores that we have obtained from our customer database (for the loyalty measure) and associated market research information (for CSAT). Each variable is scaled on a 1 to 5 basis – with 1 being very low and 5 being very high.
There are a number of different charts shown below – from different firms. Your task is to review each one and try to identify and circle possible market segments (sets of similar data points) in each one and then answer the questions at the end.
An example has been provided for you here, where four market segments have been identified. You do not need to pick four segments each time – you can anywhere from two to six segments – and you can even use more than one approach for each graph.
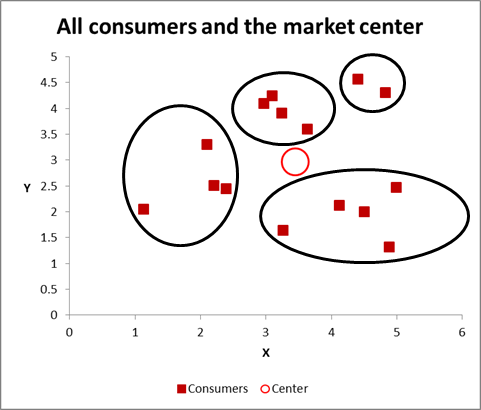
Reading the Charts
Please note that the 20 individual consumer data points are represented by the red squares and the average for all the consumers is shown by the larger red circle.
Student Discussion Questions
- Did you have the same number of segments each time?
- Were there charts where you could have constructed a different number of segments?
- Pick one of the charts and try to “describe” the segment – based on the limited information that we have?
- Are there any segments that don’t appear to make sense (from Q3)?
- Do you think that you would get more value from understanding the “obvious” segments – such as high CSAT and high loyalty, or is there more value in identifying “unexpected” segments?
- We only have two marketing variables used here – what other variables could be used as well to generate other market segments of value?
- What is a quick for/against of segmenting a market in this manner – that is, two variables on a chart?
Related Activities
- Fun Approach to Cluster Analysis
- From Market Segmentation to Marketing Mix (Drinks)
- Market Segmentation Multiple Choice Questions